资源简介
提供MATLAB画路径图测试数据,以方便测试代码,理解使用代码

代码片段和文件信息
clc
clear
A = xlsread(‘adjoin.xlsx‘);
B = xlsread(‘pos.xlsx‘);
C1 = xlsread(‘ALinepath3.xlsx‘);
C2 = xlsread(‘BLinepath3.xlsx‘);
C3 = xlsread(‘CLinepath3.xlsx‘);
cnt1 = 1;
for i = 1:6
    for j = 1:7
        if (C1(ij) > 0 && C1(ij + 1) > 0)
          D1(cnt11) = C1(ij);
          D1(cnt12) = C1(ij + 1);
          cnt1 = cnt1 + 1;
        end
    end
end

cnt2 = 1;
for i = 1:6
    for j = 1:7
        if (C2(ij) > 0 && C2(ij + 1) > 0)
          D2(cnt21) = C2(ij);
          D2(cnt22) = C2(ij + 1);
          cnt2 = cnt2 + 1;
        end
    end
end

cnt3 = 1;
for i = 1:12
    for j = 1:7
        if (C3(ij) > 0 && C3(ij + 1) > 0)
          D3(cnt31) = C3(ij);
          D3(cnt32) = C3(ij + 1);
          cnt3 = cnt3 + 1;
        end
    end
end


figure(1)
gplot(AB‘-o‘);
hold on
line([B(691) B(701)]  [B(692) B(702)]‘color‘‘r‘);
line([B(D1(11)1) B(D1(12)1)]  [B(D1(11)2) B(D1(12)2)]‘color‘‘c‘);
hold on
for l = 69:78
    line([B(l1) B(l + 11)]  [B(l2) B(l + 12)]‘color‘‘r‘);
    line([B(l1)+0.5 B(l + 11)+0.5]  [B(l2) B(l + 12)]‘color‘‘r‘);
end
hold on
for l = 80:87
   line([B(l1) B(l + 11)]  [B(l2) B(l + 12)]‘color‘‘r‘);
   line([B(l1)+0.5 B(l + 11)+0.5]  [B(l2) B(l + 12)]‘color‘‘r‘);
end
hold on
for k = 1:cnt1 - 1
    line([B(D1(k1)1) B(D1(k2)1)]  [B(D1(k1)2) B(D1(k2)2)]‘color‘‘c‘);
end
hold on
for i = 1:130
    x(i) = B(i1);
end
for i = 1:130
    y(i) = B(i2);
end
ch = {‘D1‘;‘D2‘;‘Z1‘;‘Z2‘;‘Z3‘;‘Z4‘;‘Z5‘;‘Z6‘;‘F1‘;‘F2‘;‘F3‘;‘F4‘;‘F5‘;‘F6‘;‘F7‘;‘F8‘;‘F9‘;‘F10‘;‘F11‘;‘F12‘;‘F13‘;‘F14‘;‘F15‘;‘F16‘;‘F17‘;‘F18‘;‘F19‘;‘F20‘;‘F21‘;‘F22‘;‘F23‘;‘F24‘;‘F25‘;‘F26‘;‘F27‘;‘F28‘;‘F29‘;‘F30‘;‘F31‘;‘F32‘;‘F33‘;‘F34‘;‘F35‘;‘F36‘;‘F37‘;‘F38‘;‘F39‘;‘F40‘;‘F41‘;‘F42‘;‘F43‘;‘F44‘;‘F45‘;‘F46‘;‘F47‘;‘F48‘;‘F49‘;‘F50‘;‘F51‘;‘F52‘;‘F53‘;‘F54‘;‘F55‘;‘F56‘;‘F57‘;‘F58‘;‘F59‘;‘F60‘;‘J1‘;‘J2‘;‘J3‘;‘J4‘;‘J5‘;‘J6‘;‘J7‘;‘J8‘;‘J9‘;‘J10‘;‘J11‘;‘J12‘;‘J13‘;‘J14‘;‘J15‘;‘J16‘;‘J17‘;‘J18‘;‘J19‘;‘J20‘;‘J21‘;‘J22‘;‘J23‘;‘J24‘;‘J25‘;‘J26‘;‘J27‘;‘J28‘;‘J29‘;‘J30‘;‘J31‘;‘J32‘;‘J33‘;‘J34‘;‘J35‘;‘J36‘;‘J37‘;‘J38‘;‘J39‘;‘J40‘;‘J41‘;‘J42‘;‘J43‘;‘J44‘;‘J45‘;‘J46‘;‘J47‘;‘J48‘;‘J49‘;‘J50‘;‘J51‘;‘J52‘;‘J53‘;‘J54‘;‘J55‘;‘J56‘;‘J57‘;‘J58‘;‘J59‘;‘J60‘;‘J61‘;‘J62‘;};
for i = 1:130
    text(x(i)+0.01y(i)ch(i));
end
% plot(x(4)y(4)‘.‘‘MarkerSize‘15‘color‘‘r‘);
% plot(x(5)y(5)‘.‘‘MarkerSize‘15‘color‘‘r‘);
% plot(x(6)y(6)‘.‘‘MarkerSize‘15‘color‘‘r‘);
% plot(x(7)y(7)‘.‘‘MarkerSize‘15‘color‘‘r‘);
% plot(x(8)y(8)‘.‘‘MarkerSize‘15‘color‘‘r‘);
for i = 1:6
     plot(x(C1(i1))y(C1(i1))‘.‘‘MarkerSize‘15‘color‘‘r‘);
end
title(‘A类发射装置第二波次转载到发射点的分配方案‘);
legend(‘结点‘‘主干道‘‘A的分配方案‘);
hold off

figure(2)
gplot(AB‘-o‘);
line([B(691) B(701)]  [B(692) B(702)]‘color‘‘r‘);
line([B(D2(11)1) B(D2(12)1)]  [B(D2(11)2) B(D2(12)2)]‘color‘‘g‘);
hold on
for l = 69:78
    line([B(l1) B(l + 11)]  [B(l2) B(l + 12
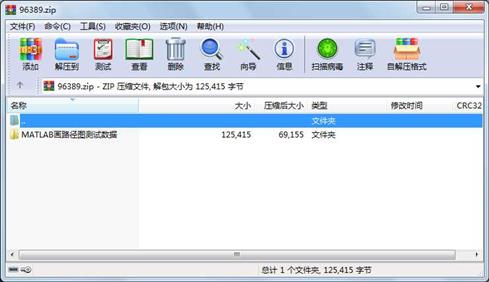
属性 大小 日期 时间 名称
----------- --------- ---------- ----- ----
文件 58686 2017-09-17 11:39 MATLAB画路径图测试数据\adjoin.xlsx
文件 14510 2017-09-19 11:45 MATLAB画路径图测试数据\ALinepath3.xlsx
文件 14492 2017-09-19 11:43 MATLAB画路径图测试数据\BLinepath3.xlsx
文件 14844 2017-09-19 11:41 MATLAB画路径图测试数据\CLinepath3.xlsx
文件 6598 2018-05-20 19:01 MATLAB画路径图测试数据\pathplot.m
文件 16285 2017-09-16 15:31 MATLAB画路径图测试数据\pos.xlsx
- 上一篇:信号检测与估计matlab仿真
- 下一篇:基于MATLAB的MMSE算法估计
 川公网安备 51152502000135号
评论
共有 条评论