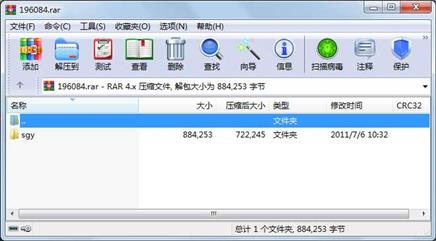
资源简介
sgy数据文件,和网上流传的在MALTAB中sgy文件的处理程序,包含读,写等!

代码片段和文件信息
function [dataout sampint varargout] = altreadsegy(sgyfile varargin)

% function [dataout sampint ...] = altreadsegy(sgyfile ‘property_name‘ property_value ...)
%
% Reads segy data into a structured array format in Matlab workspace.
%
% dataout   = a 2-D array containing the data of interest
% sampint   = sample interval in seconds (optional)
%
% Optional properties
%
% textheader
%   yes    - sends the text header to one of the output arguments
%
% textformat
%   ascii  - force text header to be interpretted as ascii
%   ebcdic - force text header to be interpretted as ebcdic
%
% fpformat
%   ibm    - force floating point numbers to be interpreted as IBM360 floating point format (SEG-Y prior to 2002)
%   ieee   - force floating point numbers to be interpreted as IEEE floating point format (SEG-Y revision 2 (after 2002))
%            and some non-standard SEG-Y generating software -- particularly on PC systems
% traces
%   specify a vector of desired traces within the file.  The first trace is 1.  For example to read every third trace:
%   traces = 1:3:ntraces
%
% nt
%   - for non-compliant SEG-Y files which contain a missing or incorrect
%             number of samples per trace in the binary header one can supply this
%             value.  Not recommended for typical use.
%
% The following properties DO NOT WORK YET but are planned:
% times    - specify the desired time window: [starttime endtime]  (both in fractional seconds)
% depths   - specify the desired depth window: [startdepth enddepth]  (both in fractional seconds)
% traceheader   - specify a headers to retreive (possible header names: sxsyrxrycdp).
%            A vector of header values is generated for each header word (indexed by trace).
%            One output argument must be supplied for each desired header.  To obtain more than one header
%            separate the header names with a comma.
%                For example: [datadtsxsyrxry] = altreadsegy(‘foo.sgy‘‘headers‘‘sxsyrxry‘)
% timevector - return a vector of times corresponding to samples in dataout.
%
%
% Examples:
%
% Read and display all the seismic data:
%  dataout = altreadsegy(‘foo.sgy‘);
%  plotseis(dataout);
%
% Read the data display it with the correct time scale and view the text header:
%  [dataout sampint textheader] = altreadsegy(‘foo.sgy‘‘textheader‘‘yes‘);
%  t = 0:sampint:(size(dataout1)-1)*sampint;
%  plotseis(dataoutt); disp(textheader);
%
% Troubleshooting advise:  add ‘verbose‘‘yes‘ to your argument list like
% this:
%  dataout = altreadsegy(‘foo.sgy‘‘verbose‘‘yes‘);
%
property_strings = ...
    {‘textformat‘‘fpformat‘‘segfmt‘‘traces‘‘times‘‘depths‘‘textheader‘‘traceheader‘‘verbose‘‘nt‘};

argout=0;

verbose = FindValue(‘verbose‘property_stringsvarargin{:});

if (~ischar(sgyfile))
	error(‘First argument must be a file name‘);
end

fileinfo = dir(sgyfile); % Fileinfo is a str
属性 大小 日期 时间 名称
----------- --------- ---------- ----- ----
文件 10572 2003-07-15 08:44 sgy\altreadsegy.m
文件 5903 2004-08-13 14:23 sgy\altwritesegy.m
文件 2137 2002-07-09 13:07 sgy\ascii2ebcdic.m
文件 1881 2002-11-29 15:05 sgy\ebcdic2ascii.m
文件 863760 2011-04-20 23:31 sgy\shot.sgy
目录 0 2011-07-06 10:32 sgy
----------- --------- ---------- ----- ----
884253 6
- 上一篇:信道编码程序matlab
- 下一篇:IQ FFT 频谱
 川公网安备 51152502000135号
评论
共有 条评论