资源简介
matlabIQ调制程序

代码片段和文件信息
clear all
close all
clc

%全局变量
%N=2^12                                 %宽度,或称为点数
Ts=0.01        ;%时间分辨率(时间间隔),抽样时间间隔
t=0:Ts:10         ;                      %时间坐标
N=length(t);
fs=1/Ts;
df=fs/(N-1)   ;                          %df为频率分辨率(频率间隔)
n=-(N-1)/2:(N-1)/2;
f=n*df       ;                           %频率坐标

%基带信号
figure
p=[1 0 1 1 0 1 0 0 1 1]   ;             %待传送的编码串可用randint(1n)产生信源;若用rand(1nM),则范围是1~M-1
d1=[0:1:t(end)-1]         ;             %每个编码的发送延迟时间
p1=[pzeros(length(d1)-length(p))] ;    %在发送串后补零
d=[d1;p1]‘                    ;         %产生d矩阵
m=pulstran(t-0.5d‘rectpuls‘);
subplot(211)
plot(tm)
axis([t(1) t(end) -0.5 1.5])
grid on
title(‘基带信号p‘)
%基带信号频谱
M=fft(m);
M=fftshift(M);
subplot(212)
plot(fabs(M)/N)
title(‘基带信号频谱‘)

%抽取IQ信号  BPSK只映射一路I。QPSK两个基带符号为一组,映射到一对IQ
figure
pQI=reshape(p25);
pQ=pQI(1:);
pI=pQI(2:);
d2=[0:2:t(end)-2];
dQ=[d2;pQ]‘;
dI=[d2;pI]‘;
mI=pulstran(t-1dI‘rectpuls‘2);
mQ=pulstran(t-1dQ‘rectpuls‘2);
subplot(211)
plot(tmI)
axis([t(1) t(end) -0.5 1.5])
grid on
title(‘I路抽取‘)
subplot(212)
plot(tmQ)
axis([t(1) t(end) -0.5 1.5])
grid on
title(‘Q路抽取‘)
%IQ值映射   “0”映射成1,“1”映射成-1
figure
I(pI==1)=-1;
I(pI==0)=1;
Q(pQ==1)=-1;
Q(pQ==0)=1;
dImap=[d2;I]‘;
dQmap=[d2;Q]‘;
mImap=pulstran(t-1dImap‘rectpuls‘2);
mQmap=pulstran(t-1dQmap‘rectpuls‘2);
subplot(211)
plot(tmImap)
axis([t(1) t(end) -1.5 1.5])
grid on
title(‘映射后的I路信号‘)
subplot(212)
plot(tmQmap)
axis([t(1) t(end) -1.5 1.5])
grid on
title(‘映射后的Q路信号‘)

%载波信号
fc=5                 %载波频率;
c1=cos(2*pi*fc*t);
c2=sin(2*pi*fc*t);
%载波信号频谱
figure
C1=fft(c1);
C1=fftshift(C1);
subplot(211)
plot(fabs(C1)/N)
title(‘载波cos频谱‘)
C2=fft(c2);
C2=fftshift(C2);
subplot(212)
plot(fabs(C2)/N)
title(‘载波sin频谱‘);

%已调信号
figure
s1=mImap.*c1;
subplot(311)
plot(ts1)
axis([t(1) t(end) -1.5 1.5])
title(‘I路调制cos‘)
grid on
s2=mQmap.*c2;
subplot(312)
plot(ts2)
axis([t(1) t(end) -1.5 1.5])
title(‘Q路调制sin‘);
grid on
s=s1-s2;
subplot(313)
plot(ts)
axis([t(1) t(end) -1.5 1.5])
title(‘进入信道的信号s=s1-s2‘)
grid on

%已调信号频谱
figure
S1=fft(s1);
S1=fftshift(S1);
subplot(311)
plot(fabs(S1)/N)
title(‘s1频谱‘)
S2=fft(s2);
S2=fftshift(S2);
subplot(312)
plot(fabs(S2)/N)
title(‘s2频谱‘)
S=fft(s);
S=fftshift(S);
subplot(313)
plot(fabs(S)/N)
title(‘s频谱‘)

%通过信道后接收到信号
figure
r=awgn(s10);
subplot(211)
plot(tr)
axis([t(1) t(end) -1.5 1.5])
title(‘接收信号时域‘)
%接收信号的频谱
R=fft(r);
R=fftshift(R);
subplot(212)
plot(fabs(R)/N)
title(‘接收信号频域‘)

%解调
figure
y1=r.*c1;
subplot(211)
plot(ty1)
axis([t(1) t(end) -1.5 1.5])
title(‘I路解调‘)
y2=r.*(-c2);
subplot(212)
plot(ty2)
axis([t(1) t(end) -1.5 1.5])
title(‘Q路解调‘)


%解调后从时域积分(求和)判决
y1sum=0;
y2sum=0;
for i=1:5
    y1sum(i)=sum(y1(200*(i-1)+1:200*i));
    y2sum(i)=sum(y2(200*(i-1)+1:200*i));
end
y1d=sign(y1sum);
y2d=sign(y2sum);

%反映射
y1rmap(y1d==1)=0;
y1rmap(y1d==-1)=1;
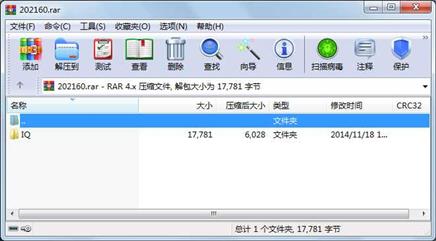
属性 大小 日期 时间 名称
----------- --------- ---------- ----- ----
文件 3557 2014-11-10 10:47 IQ\3971002my_QPSKmod_201107\my_QPSKmod_201107.m
文件 5398 2008-03-07 14:44 IQ\40474840lfm_iq\lfm_iq.m
文件 1203 2009-04-18 21:44 IQ\69154523IQ\IQ.m
文件 5811 2009-06-22 14:43 IQ\786579139IQ\IQ.m
文件 355 2014-11-10 10:55 IQ\786579139IQ\Unti
文件 1457 2010-04-22 21:28 IQ\877815358IQ\IQ.m
目录 0 2014-11-10 10:45 IQ\3971002my_QPSKmod_201107
目录 0 2012-03-30 10:59 IQ\40474840lfm_iq
目录 0 2012-03-30 10:59 IQ\69154523IQ
目录 0 2014-11-10 10:55 IQ\786579139IQ
目录 0 2012-03-30 11:00 IQ\877815358IQ
目录 0 2014-11-18 16:43 IQ
----------- --------- ---------- ----- ----
17781 12
 川公网安备 51152502000135号
评论
共有 条评论