资源简介
matlab开发-洛特卡沃尔特捕食者普利莫德尔。绘制Lotka-Volterra模型的相位图和时间序列

代码片段和文件信息
% =========================================================================
% Matlab program to draw a phase portrait for the LotkaVolterra Predetor
% Pey model. The results are shown at each time step.
% In addition the user has the option of plotting a time series graph for x or y.
% Set the parameter choice = 1 for a time series plot for x.
% Set choice = 2 for a time series plot for y.
% Equation parameters alpha beta gamma and detla can be changed by the
% user.
% Equations are solved using a numerical ODE solver.
%
% James Adams 3/4/14
% =========================================================================

function LotkaVolterra_JA
clear  % Clears command window
clc    % Clears command history
clf    % Removes anything in the figure window before simulation.

% =============== Set choice to 1 or 2 ====================================
choice = 2;

countdown = 5;  % Countdown time length before simulation runs.
iterations = 1;  % Sets initial interation count to 1;
pausetime = 0.1;  % Shows solutions at each time step.
runtime = 10;    % Duration time of simulation.

% ================ Equation parameter values ==============================
alpha = 1;
beta = 8/3;
gamma = 1;
delta = 1;

% =============== Initial conditions for x and y ==========================
initialx = 1;
initialy = 1;

fprintf(‘----------------------------------\nLotkaVolterra Predetor Prey model \n\nMatlab code written by James Adams\n----------------------------------‘)
fprintf(‘\n\nParameter values set‘)
fprintf(‘\n\nalpha = %2.6f \nbeta = %2.6f \ngamma = %2.6f \ndelta = %2.6f ‘alphabetagammadelta)
fprintf(‘\n\nTo plot a time series graph for x set the choice parameter in the code to 1.‘)
fprintf(‘\nSet choice to 2 to plot a time series graph for y.\n\nSimulation will run in ‘)

for i = 5:-1:1
    fprintf(‘\n%8i‘countdown‘)    % Countdown to simulation start.
    countdown = countdown-1;
    pause(1)
end

% Solves equations using numerical ODE solver 45 (nonstiff runge kutta)
deq1=@(tx) [x(1)*(alpha - beta*x(2)); -x(2)*(gamma-delta*x(1))];
[tsol] = ode45(deq1[0 runtime][initialx initialy]);

arraysize = size(t);  % Sets time array size for the for loop.

%============ Solutions are plotted at each time step =====================

for i = 1 : max(arraysize)
    subplot(211)
    plot(sol(iterations1)sol(iterations2)‘.‘‘color‘[rand; rand; rand]‘markersize‘14‘MarkerFaceColor‘‘b‘);
    hold on
    title([‘Lotka-Volterra Equations       t = ‘ num2str(t(iterations))]‘fontsize‘12)
    xlabel(‘x‘‘fontsize‘12)
    ylabel(‘y‘‘fontsize‘12)
    axis([min(sol(:1)) max(sol(:1)) min(sol(:2)) max(sol(:2))])

    subplot(212)
    text(0.10.5‘Time Series graph will be shown at the end of the simulation‘)

    iterations = iterations + 1;   % Adds 1 to the iteration count.
    pause(pausetime)
end

% ==== Plots time series
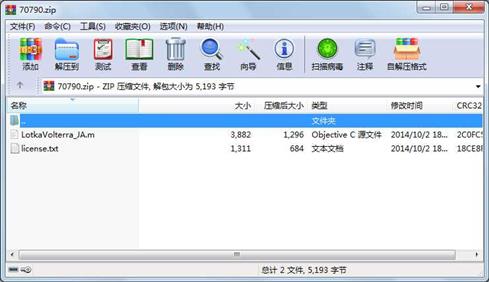
属性 大小 日期 时间 名称
----------- --------- ---------- ----- ----
文件 3882 2014-10-02 18:18 LotkaVolterra_JA.m
文件 1311 2014-10-02 18:18 license.txt
- 上一篇:matlab开发-2加权多项式拟合与估值
- 下一篇:RLS的数据预测与matlab
 川公网安备 51152502000135号
评论
共有 条评论