资源简介
基于matlab的信号频域的相干分析,希望在不同方向对大家有所帮助

代码片段和文件信息
%% 分析x与y的相干性 频域线性相关性 找到相关性最强的频带及该频带的相位差
function coherence(xy)
n=length(x);
% nfft = 2^(nextpow2(n)-1);
nfft=500;
fs=1000;
[cxy1f1]=mscohere(xyhanning(nfft)nfft/2nfftfs);%窗口有50%的重叠
cxy=sqrt(cxy1);
% figure;
% plot(f1cxy);
m=(n/(nfft/2))-1;%窗口个数
CL=1-0.05^(1/(m-1));
CL=CL*ones(1length(f1));
figure;
plot(f1cxy‘-k‘f1CL‘-r‘);
% axis([0 50 0 max(c(1:50))]);
% ylabel(‘S‘);xlabel(‘Hz‘);
% axis([0 50]);
xlabel(‘f/Hz‘);ylabel(‘coherence‘);
f = 0:fs/nfft:fs/2;
f = f‘;
w = hanning(nfft);
z = csd(xynfftfswnfft/2);
t=n/fs;
Time = 0.001:0.001:t;
%绘制两个互谱信号的时程曲线图
figure;
subplot(211);
plot(Timex);
xlabel(‘时间(s)‘);
ylabel(‘幅值‘);
grid on;
title(‘信号时程曲线‘);
subplot(212);
plot(Timey);
xlabel(‘时间(s)‘);
ylabel(‘幅值‘);
grid on;

%绘制幅频曲线图
[maxvaluemaxindex] = max(abs(z));
maxfreq = f(maxindex);
phase = angle(z(maxindex));
phasedeg = rad2deg(phase);
figure;
nn = 1:nfft/8;
subplot(211);
plot(f(nn)abs(z(nn))‘b-‘20maxvalue‘ro‘);
%axis([0 50]);
xlabel(‘频率(Hz)‘);
ylabel(‘幅值‘);
textlable=strcat(‘\leftarrow f= ‘num2str(maxfreq));
text(maxfreqmaxvaluetextlable‘Fontsize‘14‘Color‘‘r‘);
grid on;
title(‘互谱幅频、相频曲线‘‘Units‘‘normalized ‘‘Position‘[0.5 1]‘FontSize‘13);
subplot(212);
plot(f(nn)angle(z(nn))‘b-‘maxfreqphase‘ro‘); %axis([0 50]);
xlabel(‘频率(Hz)‘);
ylabel(‘相位‘);
textlable=strcat(‘\leftarrow phase= ‘num2str(phase));
text(maxfreqphasetextlable‘Fontsize‘14‘Color‘‘r‘);
grid on;

disp([‘****   The phase between ‘‘c3‘‘ and ‘‘emg‘‘ is: ‘num2str(phasedeg)‘ deg.   ****‘]);
timedelay = phase/(2*pi*maxfreq);
disp([‘****   The delaytime between ‘‘c3‘‘ and ‘‘emg‘‘ is: ‘num2str(timedelay*1000)‘ ms.   ****‘]);
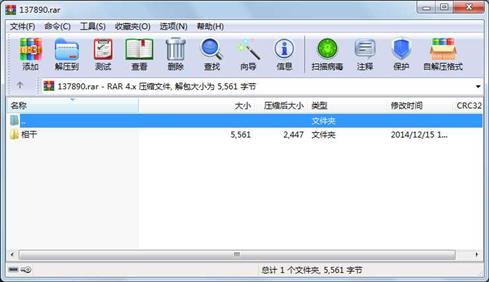
属性 大小 日期 时间 名称
----------- --------- ---------- ----- ----
文件 1830 2013-04-28 15:39 相干\coherence.m
文件 3411 2011-11-29 09:28 相干\myphase.m
文件 320 2013-04-29 19:23 相干\pinpu.m
目录 0 2014-12-15 19:50 相干
----------- --------- ---------- ----- ----
5561 4
- 上一篇:Alamouti MATLAB仿真
- 下一篇:RLS算法的matlab实现
 川公网安备 51152502000135号
评论
共有 条评论