资源简介
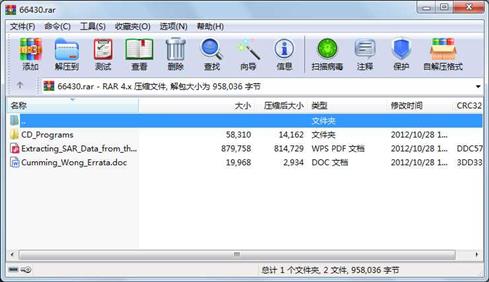
《合成孔径雷达成像算法与实现》一书附带光盘中数据读取程序及文档说明

代码片段和文件信息
% compute_azim_spectra.m
% ----------------------
%
% Divides the range swath (range cells) of this block into Nspect sections
% and finds the average power spectrum for each segment.
%
% Fits a parabola to the baseband Doppler centroid vs. range
% This fit is most useful if the whole range swath is selected but the
% computing times get large if more than 1024 range lines (azimuth cells)
% are selected in one run.
%
% Run “specify_run_parameters.m“ and “extract_data.m“ first to extract
% the data from the CD. The data can be stored in MAT or binary files.
% -------------------------------------------------------------------------

%  Load the parameters for this run
clear    format compact
set( 0 ‘DefaultTextFontSize‘   12 )  % Plotting defaults
set( 0 ‘DefaultLineLineWidth‘ 1.5 )
set( 0 ‘DefaultAxesFontSize‘    8 )
tfs = 13;    lfs = 11;
load CD_run_params

disp ‘ ‘
disp ‘---------------------------------------------------------‘
fprintf(‘ UBC RRSG - Plot the azimuth spectrum of each data block‘)
disp ‘ ‘
disp ‘---------------------------------------------------------‘

Nrowsg = 3;     % Number of subplots in row direction of the figure
Ncolsg = 3;     % Number of subplots in column direction of the figure
Nspect = Nrowsg*Ncolsg;         % Total number of spectra to calculate
Nrglpb = floor( Nrg_cells/Nspect );  %  No. of range cells per spectra
wd = 0.81/Ncolsg;   dx = wd + 0.045;   x0 = 0.07;
ht = 0.39/Nrowsg;   dy = 0.28;         y0 = 1-dy;

for b = 1 : Nblocks

    file_pre = strcat( output_path output_prefix ‘_‘ num2str(b) );

    disp ‘ ‘
    disp ([‘Load or Extract AGC setting and Data for block ‘ num2str(b) ])
    %  Load a block of ‘AGC_values‘
    AGC_values = load_AGC_block( file_pre first_rg_line ...
                                          Nrg_lines_blk b  UseMATfiles );

    %  Load a block of raw SAR data
    data = load_DATA_block( file_pre output_path Nrg_lines_blk ...
                             Nrg_cells AGC_values b UseMATfiles );

    disp ‘Compute and plot azimuth power spectra‘
    tic
    figure(202) clf
    freq = [0:Nrg_lines_blk-1]*PRF/Nrg_lines_blk;
    b1 = first_rg_line + (b-1) * Nrg_lines_blk;
    b2 = first_rg_line + b * Nrg_lines_blk - 1;

    %  Find azimuth power spectra and average
    for krg = 1 : Nspect
        r1 = 1 + (krg-1)*Nrglpb;   r2 = r1 + Nrglpb - 1;
        DATA = fft( data(:r1:r2) );
        DATA_aver(krg:) = mean( abs(DATA.‘).^2 )/1000000;
        ysc(krg) = 1.05*max(DATA_aver(krg:));
    end  % of for krg = 1 : Nspect
    ysc0 = max( ysc );      %  Common vertical scaling for all the spectra

    %  Plot the azimuth spectrum

    for krg = 1 : Nspect
        subplot(Nrowsg Ncolsg krg)
        plot( freq DATA_aver(krg:) )   grid   hold on
        set( gca ‘Pos‘...
           [x0+dx*mod((krg-1)Ncolsg)  y0-dy*floor((
属性 大小 日期 时间 名称
----------- --------- ---------- ----- ----
文件 19968 2012-10-28 16:05 Cumming_Wong_Errata.doc
文件 879758 2012-10-28 16:06 Extracting_SAR_Data_from_the_CD.pdf
文件 19632 2005-01-21 11:24 CD_Programs\AGC_attenuation_values.mat
文件 5541 2005-01-26 10:31 CD_Programs\compute_azim_spectra.m
文件 4247 2004-12-30 19:00 CD_Programs\extract_AGC.m
文件 5245 2005-01-19 11:51 CD_Programs\extract_data.m
文件 2392 2005-01-21 11:57 CD_Programs\load_AGC_block.m
文件 3116 2004-12-30 18:12 CD_Programs\load_DATA_block.m
文件 7064 2005-01-21 12:56 CD_Programs\read_CEOS_raw.m
文件 5572 2012-10-28 16:53 CD_Programs\specify_parameters.asv
文件 5501 2012-10-28 17:05 CD_Programs\specify_parameters.m
目录 0 2012-10-28 16:38 CD_Programs
----------- --------- ---------- ----- ----
958036 12
相关资源
- ACCESS财务报表(带数据).accdb
- LCD显示温度+串口接收温度.rar
- 编程实现二维DCT变换
- CSMA/CD等动画演示加源代码
- 图像二值化
- Img2Lcd(将图片转换为数组的工具)
- 用FFT对信号进行频谱分析
- 基于c8051f020的AD转换程序及LCD显示程序
- [免费]msp430f149控制PS2键盘并用1602显示
- ICD10 excel
- arm触摸屏与LCD校准程序三点校准法
- vhdl与lcd1602实现的多控制电子钟
- Tone-Reservation
- pctolcd2002完美版460701
- QGA 量子遗传算法
- ADC0809数字电压表 LCD1602显示 汇编程序
- lcd12684显示程序
- lcd12864的VHDL程序
- CD7110客显测试程序
- LCD12864滚动显示
- 差分形式的阻滞增长模型
- 遗传算法的M文件
- 收藏奉献_DOS汉字系统03:WPS 2.0 + 金山
- ECC和ECDSA算法
- 偏振深非弹性散射中包容性重味产生
- STM32 电子密码锁设计,LCD12864显示
- STM32 LCD12864并口驱动实验
- 类似QCD的新领域中的Theta
- 从动态晶格QCD模拟得出迷人的四夸克
- 从晶格QCD计算中提取parton分布函数
 川公网安备 51152502000135号
评论
共有 条评论