资源简介
Qt(动态数据模拟)曲线。
高端大气上档次,狂拽炫酷版。

代码片段和文件信息
#pragma execution_character_set(“utf-8“)

#include “curvechart.h“
#include “qpainter.h“
#include “qdebug.h“

CurveChart::CurveChart(QWidget *parent) : QWidget(parent)
{
    minValue = 0;
    maxValue = 100;
    xStep = 10;
    yStep = 10;

    space = 40;
    title = “曲线图“;
    showHLine = true;
    showPoint = true;
    showPointBg = true;

    bgColorStart = QColor(79 79 79);
    bgColorEnd = QColor(51 51 51);
    textColor = QColor(250 250 250);
    pointColor = QColor(38 114 179);
}

void CurveChart::paintEvent(QPaintEvent *)
{
    //绘制准备工作启用反锯齿
    QPainter painter(this);
    painter.setRenderHints(QPainter::Antialiasing | QPainter::TextAntialiasing);

    //绘制背景
    drawBg(&painter);
    //绘制盒子
    drawBox(&painter);
    //绘制文字
    drawText(&painter);
    //绘制标题
    drawtitle(&painter);
    //绘制数据点
    drawPoint(&painter);
}

void CurveChart::drawBg(QPainter *painter)
{
    painter->save();
    painter->setPen(Qt::NoPen);
    QLinearGradient topGradient(rect().topLeft() rect().bottomLeft());
    topGradient.setColorAt(0.0 bgColorStart);
    topGradient.setColorAt(1.0 bgColorEnd);
    painter->setBrush(topGradient);
    painter->drawRect(rect());
    painter->restore();
}

void CurveChart::drawBox(QPainter *painter)
{
    painter->save();

    QPointF topLeftPot(space space);
    QPointF bottomRightPot(width() - space / 2 height() - space / 2);
    painter->setPen(textColor);
    painter->setBrush(Qt::NoBrush);

    pointRect = QRectF(topLeftPot bottomRightPot);
    painter->drawRect(pointRect);

    //绘制横线
    if (showHLine) {
        QPen pen(textColor 1 Qt::DotLine);
        painter->setPen(pen);

        int step = (maxValue - minValue) / xStep;
        double increment = (double)pointRect.height() / step;
        double startY = pointRect.topLeft().y();

        for (int i = 0; i < step - 1; i++) {
            startY += increment;
            QPointF leftPot(pointRect.topLeft().x() startY);
            QPointF rightPot(pointRect.topRight().x() startY);
            painter->drawLine(leftPot rightPot);
        }
    }

    painter->restore();
}

void CurveChart::drawText(QPainter *painter)
{
    painter->save();

    painter->setPen(textColor);
    painter->setBrush(Qt::NoBrush);

    int step = (maxValue - minValue) / xStep;
    int value = maxValue;
    double increment = (double)pointRect.height() / step;
    double startY = pointRect.topLeft().y();
    QString strValue;

    for (int i = 0; i <= step; i++) {
        strValue = QString(“%1“).arg(value);
        double textWidth = fontMetrics().width(strValue);
        double textHeight = fontMetrics().height();
        QPointF textPot(pointRect.topLeft().x() - 5 - textWidth startY + textHeight / 2);
        painter->drawText(textPot strValue);
        value -= xStep;
        startY += increment;
    }

    painter->restore();
}

void CurveChart::drawTit
属性 大小 日期 时间 名称
----------- --------- ---------- ----- ----
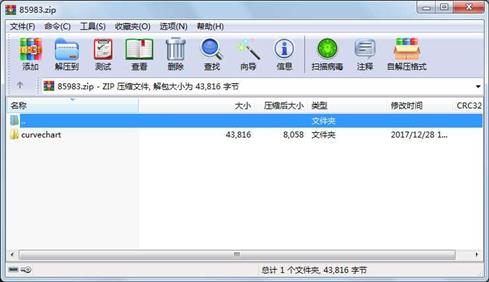
目录 0 2017-12-28 17:21 curvechart\
文件 8734 2017-02-07 17:31 curvechart\curvechart.cpp
文件 4149 2017-02-10 17:11 curvechart\curvechart.h
文件 468 2017-02-08 09:57 curvechart\curvechart.pro
文件 23877 2017-12-28 17:21 curvechart\curvechart.pro.user
文件 1797 2017-01-02 14:37 curvechart\frmcurvechart.cpp
文件 631 2016-12-13 17:18 curvechart\frmcurvechart.h
文件 3614 2017-01-02 15:33 curvechart\frmcurvechart.ui
文件 546 2017-02-08 09:57 curvechart\main.cpp
相关资源
- Qt界面外观
- [嵌入式Linux项目实战开发]基于QT4.7.
- Qt GUI 界面通用系统模板 源码
- 网上的一款QT界面设计的电子地图
- 二维码解析
- linux下关于Qt界面的摄像头v4l2操作源码
- 360UI完美界面
- 净化设备管理
- 基于qt界面的语音交互软件
- 综合组件的界面
- opencv打开图片并显示在Qt界面上
- Qt360 界面
- 动态绘制曲线
- QtitanRibbon3.zip
- VS+QT环境下读取excel文件到QT界面,并
- 基于嵌入式QT界面GPS定位系统
- [嵌入式Linux项目实战开发]基于QT4.7.
- 物联网 智能家居 Qt界面
- 将QT界面做成dll在qt其他程序中调用
-
将xm
l内容显示Qt界面 - DS18B20测温及QT界面实现
- qt界面跳转切换
- 基于v4l的视频采集显示程序。外加Q
- QT计算器界面和计算器功能实现
- qt界面连接wifi
- myseria串口
- 基于Qt界面显示的温湿度检测
- Qt界面多线程opencv调用摄像头
- 智慧大棚QT界面设计
- Qt高仿网易云音乐界面源码
 川公网安备 51152502000135号
评论
共有 条评论