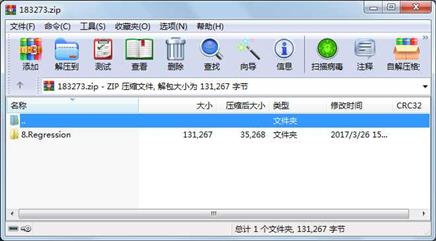
资源简介
本文件包含多个数据集的代码示例,有广告、莺尾花、波士顿房价数据的回归代码,附带数据集,画出鸢尾花数据不同分类器的ROC和AUC曲线图

代码片段和文件信息
#!/usr/bin/python
# -*- coding:utf-8 -*-

import csv
import numpy as np
import matplotlib as mpl
import matplotlib.pyplot as plt
import pandas as pd
from sklearn.model_selection import train_test_split
from sklearn.linear_model import LinearRegression
from pprint import pprint


if __name__ == “__main__“:
    path = ‘Advertising.csv‘
    # # 手写读取数据
    # f = file(path)
    # x = []
    # y = []
    # for i d in enumerate(f):
    #     if i == 0:
    #         continue
    #     d = d.strip()
    #     if not d:
    #         continue
    #     d = map(float d.split(‘‘))
    #     x.append(d[1:-1])
    #     y.append(d[-1])
    # pprint(x)
    # pprint(y)
    # x = np.array(x)
    # y = np.array(y)

    # Python自带库
    # f = file(path ‘r‘)
    # print f
    # d = csv.reader(f)
    # for line in d:
    #     print line
    # f.close()

    # # numpy读入
    # p = np.loadtxt(path delimiter=‘‘ skiprows=1)
    # print p
    # print ‘\n\n===============\n\n‘

    # pandas读入
    data = pd.read_csv(path)    # TV、Radio、Newspaper、Sales
    # x = data[[‘TV‘ ‘Radio‘ ‘Newspaper‘]]
    x = data[[‘TV‘ ‘Radio‘]]
    y = data[‘Sales‘]
    print x
    print y

    mpl.rcParams[‘font.sans-serif‘] = [u‘simHei‘]
    mpl.rcParams[‘axes.unicode_minus‘] = False

    # 绘制1
    plt.figure(facecolor=‘w‘)
    plt.plot(data[‘TV‘] y ‘ro‘ label=‘TV‘)
    plt.plot(data[‘Radio‘] y ‘g^‘ label=‘Radio‘)
    plt.plot(data[‘Newspaper‘] y ‘mv‘ label=‘Newspaer‘)
    plt.legend(loc=‘lower right‘)
    plt.xlabel(u‘广告花费‘ fontsize=16)
    plt.ylabel(u‘销售额‘ fontsize=16)
    plt.title(u‘广告花费与销售额对比数据‘ fontsize=20)
    plt.grid()
    plt.show()

    # 绘制2
    plt.figure(facecolor=‘w‘ figsize=(9 10))
    plt.subplot(311)
    plt.plot(data[‘TV‘] y ‘ro‘)
    plt.title(‘TV‘)
    plt.grid()
    plt.subplot(312)
    plt.plot(data[‘Radio‘] y ‘g^‘)
    plt.title(‘Radio‘)
    plt.grid()
    plt.subplot(313)
    plt.plot(data[‘Newspaper‘] y ‘b*‘)
    plt.title(‘Newspaper‘)
    plt.grid()
    plt.tight_layout()
    plt.show()

    x_train x_test y_train y_test = train_test_split(x y train_size=0.8 random_state=1)
    print type(x_test)
    print x_train.shape y_train.shape
    linreg = LinearRegression()
    model = linreg.fit(x_train y_train)
    print model
    print linreg.coef_ linreg.intercept_

    order = y_test.argsort(axis=0)
    y_test = y_test.values[order]
    x_test = x_test.values[order :]
    y_hat = linreg.predict(x_test)
    mse = np.average((y_hat - np.array(y_test)) ** 2)  # Mean Squared Error
    rmse = np.sqrt(mse)  # Root Mean Squared Error
    print ‘MSE = ‘ mse
    print ‘RMSE = ‘ rmse
    print ‘R2 = ‘ linreg.score(x_train y_train)
    print ‘R2 = ‘ linreg.score(x_test y_test)

    plt.figure(facecolor=‘w‘)
    t = np.arange(len(x_test))
    plt.plot(t y_test ‘r-‘ linewidth=2 label=u‘真实数据‘)
    plt.plot(t y_hat ‘g-‘ linewi
属性 大小 日期 时间 名称
----------- --------- ---------- ----- ----
目录 0 2017-03-26 15:25 8.Regression\
目录 0 2017-03-26 15:25 8.Regression\.idea\
文件 459 2017-03-26 13:28 8.Regression\.idea\8.Regression.iml
文件 687 2017-03-26 13:28 8.Regression\.idea\misc.xm
文件 276 2017-03-26 13:23 8.Regression\.idea\modules.xm
文件 32825 2017-03-26 14:36 8.Regression\.idea\workspace.xm
文件 3247 2017-03-26 14:12 8.Regression\8.1.Advertising.py
文件 1734 2017-03-26 14:15 8.Regression\8.2.LinearRegression_CV.py
文件 5062 2017-03-26 14:17 8.Regression\8.3.ElasticNet.py
文件 4616 2017-03-26 14:17 8.Regression\8.4.Iris_LR.py
文件 2602 2017-03-26 14:27 8.Regression\8.5.Boston.py
文件 2590 2017-03-26 14:33 8.Regression\8.6.ARIMA.py
文件 6205 2017-03-26 14:34 8.Regression\8.7.roc_auc_intro.py
文件 2735 2017-03-26 14:35 8.Regression\8.8.roc_auc.py
文件 3016 2017-03-26 14:35 8.Regression\8.9.roc_auc_iris.py
文件 4756 2016-11-05 14:42 8.Regression\Advertising.csv
文件 1746 2017-03-15 01:13 8.Regression\AirPassengers.csv
文件 49082 2016-11-21 13:49 8.Regression\housing.data
文件 2080 2016-11-21 13:49 8.Regression\housing.names
文件 4551 2016-11-05 14:42 8.Regression\iris.data
文件 2998 2016-11-05 14:42 8.Regression\iris.names
- 上一篇:labview编写的小程序
- 下一篇:safety mechanisms
相关资源
- Pythonamp;课堂amp;笔记(高淇amp;400;集第
- Python中Numpy库最新教程
- 用python编写的移动彩信的发送程序
- Python全栈学习笔记面向对象大作业:
- python实现的ftp自动上传、下载脚本
- Python版的A*寻路算法
- IronPython IDE
- pip-10.0.1.tar.gz
- Data Science from Scratch 2nd Edition
- shape_predictor_68_face_landmarks.dat.bz2 68个标
- 爬取豆瓣电影TOP250程序,包含非常详
- 中文维基百科语料库百度网盘网址.
- MSCNN_dehaze.rar
- 爬取豆瓣排行榜电影数据(含GUI界面
- 字典文本资源
- Brainfuck / OoK 解码脚本
- 案例实战信用卡欺诈检测数据集
- 招商策略_抱团启示录那些年我们一起
- sip-4.19.zip
- 树莓派3b+学习使用教程
- numpy 中文学习手册
- pytorch-1.4.0-py3.7_cpu_0.tar.bz2
- 机器学习实战 高清完整版PDF
- 泰坦尼克号0.81准确率实验报告.docx
-
abaqus sc
ripting reference manual.pdf - 网页版聊天程序--网络程序设计课程大
- Give Me Some Credit
-
ba
semap安装出错时,正确得pyproj文件 - 微信头像拼接工具
- 统计思维:程序员数学之概率统计第
 川公网安备 51152502000135号
评论
共有 条评论