资源简介
三条每条100万数据点曲线实时追踪无延迟,边界跳0无数据,本文所用为QcustomPlot2.0.1。 首先说的是对上边所提第一篇博客做的修改,代码如下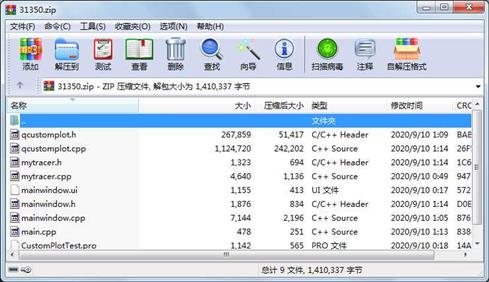
代码片段和文件信息
/****************************************************************
 Doc    :   main.cpp
 Author :   BingLee
 Date   :   2018-11-08
 Info   :   QCustomPlot test demo
 https://blog.csdn.net/Bing_Lee (C)All rights reserved.
******************************************************************/
#include “mainwindow.h“
#include

int main(int argc char *argv[])
{
    QApplication a(argc argv);
    MainWindow w;
    w.show();

    return a.exec();
}
属性 大小 日期 时间 名称
----------- --------- ---------- ----- ----
文件 1142 2020-09-10 00:18 CustomPlotTest.pro
文件 478 2020-09-10 01:13 main.cpp
文件 7144 2020-09-10 01:05 mainwindow.cpp
文件 1876 2020-09-10 01:14 mainwindow.h
文件 1155 2020-09-10 00:17 mainwindow.ui
文件 4640 2020-09-10 00:49 mytracer.cpp
文件 1323 2020-09-10 01:14 mytracer.h
文件 1124720 2020-09-10 01:14 qcustomplot.cpp
文件 267859 2020-09-10 01:09 qcustomplot.h
- 上一篇:计算机图形学——基于OpenGL绘制三维图形
- 下一篇:103规约主站侧源代码
相关资源
- QCustomPlot下载278871
- qt下超强绘图控件 QCustomPlot
- qt下超强绘图控件 - QCustomPlot
- qcustomplot_demo4.zip
- qcustomplot_realtime.zip
- QCustomPlot 实验demo
- QCustomPlotDemo范例
- QCustomPlot鼠标跟随显示坐标值
- qt用QCustomPlot实现鼠标实时回调xy轴数
- QCustomPlot之QCPAxisTicker坐标轴类功能实
- QT使用QCustomPlot绘制曲线并动态显示曲
- TimeDynamicListDemo.rar
- qcustomplot.zip
- 基于Qt的实时曲线绘制
- QCustomPlot
- qcustomplot鼠标点击后在坐标轴显示值
- QT中利用QCustomPlot类画曲线图
- QCustomPlot时间横坐标轴动态刷新unti<
- 发动机数据监测软件模拟数据.zip
- 可用动态曲线图加强版.zip
 川公网安备 51152502000135号
评论
共有 条评论