资源简介
机器学习(9)-PCA原理与实现:数据集与源码下载
机器学习(9)-PCA原理与实现:数据集与源码下载
机器学习(9)-PCA原理与实现:数据集与源码下载

代码片段和文件信息
# PCA

# Importing the libraries
import numpy as np
import matplotlib.pyplot as plt
import pandas as pd

# Importing the dataset
dataset = pd.read_csv(‘Wine.csv‘)
X = dataset.iloc[: 0:13].values
y = dataset.iloc[: 13].values

# Splitting the dataset into the Training set and Test set
from sklearn.model_selection import train_test_split
X_train X_test y_train y_test = train_test_split(X y test_size = 0.2 random_state = 0)

# Feature Scaling
from sklearn.preprocessing import StandardScaler
sc = StandardScaler()
X_train = sc.fit_transform(X_train)
X_test = sc.transform(X_test)

# Applying PCA
from sklearn.decomposition import PCA
pca = PCA(n_components = 2)
X_train = pca.fit_transform(X_train)
X_test = pca.transform(X_test)
explained_variance = pca.explained_variance_ratio_

# Fitting Logistic Regression to the Training set
from sklearn.linear_model import LogisticRegression
classifier = LogisticRegression(random_state = 0)
classifier.fit(X_train y_train)

# Predicting the Test set results
y_pred = classifier.predict(X_test)

# Making the Confusion Matrix
from sklearn.metrics import confusion_matrix
cm = confusion_matrix(y_test y_pred)

# Visualising the Training set results
from matplotlib.colors import ListedColormap
X_set y_set = X_train y_train
X1 X2 = np.meshgrid(np.arange(start = X_set[: 0].min() - 1 stop = X_set[: 0].max() + 1 step = 0.01)
                     np.arange(start = X_set[: 1].min() - 1 stop = X_set[: 1].max() + 1 step = 0.01))
plt.contourf(X1 X2 classifier.predict(np.array([X1.ravel() X2.ravel()]).T).reshape(X1.shape)
             alpha = 0.75 cmap = ListedColormap((‘red‘ ‘green‘ ‘blue‘)))
plt.xlim(X1.min() X1.max())
plt.ylim(X2.min() X2.max())
for i j in enumerate(np.unique(y_set)):
    plt.scatter(X_set[y_set == j 0] X_set[y_set == j 1]
                c = ListedColormap((‘red‘ ‘green‘ ‘blue‘))(i) label = j)
plt.title(‘Logistic Regression (Training set)‘)
plt.xlabel(‘PC1‘)
plt.ylabel(‘PC2‘)
plt.legend()
plt.show()

# Visualising the Test set results
from matplotlib.colors import ListedColormap
X_set y_set = X_test y_test
X1 X2 = np.meshgrid(np.arange(start = X_set[: 0].min() - 1 stop = X_set[: 0].max() + 1 step = 0.01)
                     np.arange(start = X_set[: 1].min() - 1 stop = X_set[: 1].max() + 1 step = 0.01))
plt.contourf(X1 X2 classifier.predict(np.array([X1.ravel() X2.ravel()]).T).reshape(X1.shape)
             alpha = 0.75 cmap = ListedColormap((‘red‘ ‘green‘ ‘blue‘)))
plt.xlim(X1.min() X1.max())
plt.ylim(X2.min() X2.max())
for i j in enumerate(np.unique(y_set)):
    plt.scatter(X_set[y_set == j 0] X_set[y_set == j 1]
                c = ListedColormap((‘red‘ ‘green‘ ‘blue‘))(i) label = j)
plt.title(‘Logistic Regression (Test set)‘)
plt.xlabel(‘PC1‘)
plt.ylabel(‘PC2‘)
plt.legend()
plt.show()
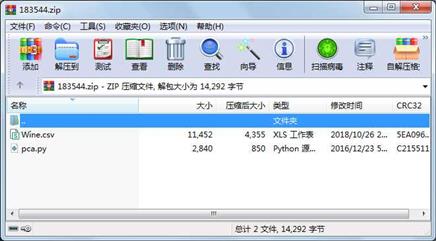
属性 大小 日期 时间 名称
----------- --------- ---------- ----- ----
文件 2840 2016-12-23 05:03 pca.py
文件 11452 2018-10-26 20:35 Wine.csv
相关资源
- LDA 人脸识别
- 核主成分分析方法——特征提取,去
- PCAAD7.0教程
- ppt 机器学习.ppt
- 满足PCAC关系的晶格QCD的轴向矢量形状
- Logistic回归总结非常好的机器学习总结
- Convex Analysis and Optimization (Bertsekas
- 机器学习个人笔记完整版v5.2-A4打印版
- JUNIOR:粒子物理学中无监督机器学习
- 语料库.zip
- WinPcap+中文技术文档
- usa_flights.csv
- 中国科学技术大学 研究生课程 机器学
- 遗传算法越野小车unity5.5
- 京东金融大数据分析平台总体架构
- 吴恩达机器学习编程题
- shape_predictor_68_face_landmarks.dat.bz2 68个标
- 机器学习实战高清pdf,中文版+英文版
- 李宏毅-机器学习(视频2017完整)
- 基于spss的数据分析第三版
- arduino pca9685多舵机同时控制案例
- 机器学习深度学习 PPT
- 麻省理工:深度学习介绍PPT-1
- Wikipedia机器学习迷你电子书之四《D
- Learning From Data Yaser S. Abu-Mostafa
- 打开软件PCAD
- 赤裸裸的统计学 14.4MB-高清PDF
- IBM SPSS数据分析与挖掘实战案例精粹
- 北大林宙辰:机器学习一阶算法的优
- PCA结合马氏距离
 川公网安备 51152502000135号
评论
共有 条评论