资源简介
某招聘网站数据分析案例,数据清洗、图表显示,python编写及数据集

代码片段和文件信息
#全国14个热门城市,搜索数据分析岗位的结果条目,共4087条
import numpy as np
import pandas as pd
import matplotlib.pyplot as plt
plt.rcParams[‘font.sans-serif‘]=[‘SimHei‘]
plt.rcParams[‘axes.unicode_minus‘] = False
data = pd.read_excel(r‘boss_zhipin.xls‘sheet_name=‘boss_res‘)
data.head()

#将id列设为索引
data1 = data.set_index(‘id‘)
data1.info()
#去除是实习工作的行,只保留全职工作
drop_lt = data1[data1[‘full_time‘]==‘否‘].index
data2 = data1.drop(drop_ltaxis=0)
data2.info() #删除后还剩4011行,一共删除了76行

#增加平均年薪列
data2[‘salary_max‘]=data2[‘salary_max‘].astype(‘int64‘)
data2[‘salary_year_avg‘] = ((data2[‘salary_min‘]+data2[‘salary_max‘])/2)*data2[‘month‘]
data2[‘salary_avg‘] = data2[‘salary_year_avg‘]/12#增加平均工资列
data2.head()
#14城总体工资分布情况
data2[‘salary_avg‘].describe()
data2[‘salary_avg‘].plot(kind=‘box‘)
plt.show()

#工资的中位数为8k,最低工资1.5k最高工资95k
data2[data2[‘salary_avg‘].isin([1.595])]#其中没有数据分析岗,而是其他的岗位,与这些公司发布职位的分类有关

#多数工资为6k-11k左右,其次为3k-6k
figax = plt.subplots(11figsize=(86))
ax.hist(data2[‘salary_avg‘]bins=20density=True)
#data2[‘salary_avg‘].plot(ax=axkind=‘kde‘)
ax.set_xticks(range(51005))
ax.grid(True)
plt.show()

data2.city.value_counts()#不同城市的工资情况
ser = data2.groupby(‘city‘)[‘salary_avg‘].median()
figa = plt.subplots(11figsize=(126))
ser.plot(kind=‘bar‘ax=awidth=0.8color=‘gold‘label=‘各城市平均工资‘)
a.plot(ser.indexnp.array(np.random.randint(8914))linestyle=‘--‘label=‘全国平均工资‘)
plt.legend(loc=‘best‘) #各城市的平均工资都高于6k其中高于全国平均线的为北京、上海、杭州、深圳、广州
data2.head()

data2[‘education‘].value_counts()#各学历分布情况
data2[data2[‘education‘]==‘博士‘]#要求博士学历的很少,看一下是哪些职位要求博士的
se = data2.groupby(‘education‘)[‘salary_avg‘].median()#学历与工资的关系
se = se.sort_values(ascending=False)
figaa = plt.subplots(11figsize=(86))
se.plot(kind=‘bar‘color=‘green‘)
plt.title(‘学历与工资的关系‘)
plt.show()
#学历越高,工资越高
#初中及以下的平均工资与本科一样,高过大专,可能是这些公司为了在招聘时博得求职者关注,应该有问题,如培训机构
data2[data2[‘education‘]==‘初中及以下‘]

#工作经验与工资的关系
ss = data2.groupby(‘experience‘)[‘salary_avg‘].median()
ss = ss.sort_values()
ss.plot(kind= ‘bar‘figsize=(106))
ss.plot(color=‘orange‘)
plt.show()
#由图可见,工作经验越高,工资越高。经验为一年以内的与经验不限的工资水平基本一样。
#从折线斜率看,新人在参加工作的前1-2年工资平稳增长,但越往后,则越值钱,可见数据分析是越老越吃香,与吃青春饭的程序员不一样。

data2[‘industry‘].value_counts()#行业与工资的关系#招聘信息共来自于89个行业,其中最多的是互联网

#绘制一个以地图为背景的行业分布词云图
import jieba
import wordcloud
from imageio import imread
mask=imread(‘Chinamap.jpg‘)
w = wordcloud.WordCloud(width=1000height=700font_path=‘msyh.ttf‘background_color=‘white‘max_words=20mask=mask)
txt = ‘‘.join(data2[‘industry‘])
ls = jieba.lcut(txt)
txt = ‘ ‘.join(ls)
res = w.generate(txt)
plt.axis(‘off‘)
plt.imshow(res)

#挑选前10个热门行业作分析
industry_lt = data2[‘industry‘].value_counts().head(10).index.tolist()
industry_data = data2[data2[‘industry‘].isin(industry_lt)]
res = industry_data.groupby([‘industry‘‘education‘])[‘salary_min‘].median()
df = res.unstack(-1)
df.plot(kind=‘bar‘figsize=(1510)width=1color=[‘g‘‘gold‘‘c‘‘m‘‘wheat‘‘cornflowerblue‘‘tomato‘‘y‘])
plt.show()
#可见平均工
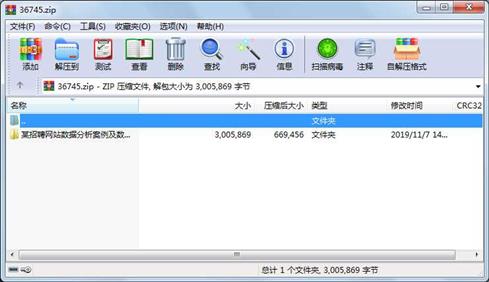
属性 大小 日期 时间 名称
----------- --------- ---------- ----- ----
文件 3000320 2019-08-22 10:04 某招聘网站数据分析案例及数据集\boss_zhipin.xls
文件 5549 2019-11-07 14:50 某招聘网站数据分析案例及数据集\源码.py
目录 0 2019-11-07 14:50 某招聘网站数据分析案例及数据集\
相关资源
- Python爬虫数据分析可视化
- python数据分析源代码Ivan Idris
- 星巴克数据分析案例及数据集.zip
- 中国联通2019年IT专业能力认证(初级
- 谁说菜鸟不用数据分析
- python凤凰新闻数据分析
- 从Excel到Python-数据分析进阶指南
- Python-数据结构与算法leetcodelintcode题解
- Python爬取淘宝上所有耐克鞋商品并进
- matplotlib-3.2.1-cp37-cp37m-win_amd64.whl
- 《Python地理空间分析指南》文字版P
- Python数据分析与机器学习-新闻分类任
- 利用 Python 进行数据分析 中文第二版
- Python数据分析与机器学习-贝叶斯实现
- Python 数据分析之金融欺诈行为检测
- Python在经济计量统计和数据分析上的
- 利用 Python 进行数据分析 原书第二版
- 利用Python进行数据分析中文第二版-
- 利用Python进行数据分析第二版(英文
- 利用 Python 进行数据分析 第二版 中文
- TMDB500电影数据分析
- 利用Python进行数据分析.pdf
- python数据分析全套课件
- 豆瓣电影大数据分析-
- python超市销售数据分析
- python数据分析:客户价值分析案例实
- Python数据分析-pandas玩转Excel - 资料.
- python数据分析博客源代码
- 利用 Python 进行数据分析 中文第二版
- 网络爬虫-Python和数据分析
 川公网安备 51152502000135号
评论
共有 条评论