资源简介
老外编的kriging插值 老外编的kriging插值 老外编的kriging插值 老外编的kriging插值

代码片段和文件信息
function [zis2zi] = kriging(vstructxyzxiyichunksize)

% interpolation with ordinary kriging in two dimensions
%
% Syntax:
%
%     [zizivar] = kriging(vstructxyzxiyi)
%     [zizivar] = kriging(vstructxyzxiyichunksize)
%
% Description:
%
%     kriging uses ordinary kriging to interpolate a variable z measured at
%     locations with the coordinates x and y at unsampled locations xi yi.
%     The function requires the variable vstruct that contains all
%     necessary information on the variogram. vstruct is the forth output
%     argument of the function variogramfit.
%
%     This is a rudimentary but easy to use function to perform a simple
%     kriging interpolation. I call it rudimentary since it always includes
%     ALL observations to estimate values at unsampled locations. This may
%     not be necessary when sample locations are not within the
%     autocorrelation range but would require something like a k nearest
%     neighbor search algorithm or something similar. Thus the algorithms
%     works best for relatively small numbers of observations (100-500).
%     For larger numbers of observations I recommend the use of GSTAT.
%
%     Note that kriging fails if there are two or more observations at one
%     location or very very close to each other. This may cause that the
%     system of equation is badly conditioned. Currently I use the
%     pseudo-inverse (pinv) to come around this problem. If you have better
%     ideas please let me know.
%
% Input arguments:
%
%     vstruct   structure array with variogram information as returned
%               variogramfit (forth output argument)
%     xy       coordinates of observations
%     z         values of observations
%     xiyi     coordinates of locations for predictions
%     chunksize nr of elements in zi that are processed at one time.
%               The default is 100 but this depends largely on your
%               available main memory and numel(x).
%
% Output arguments:
%
%     zi        kriging predictions
%     zivar     kriging variance
%
% Example:
%
%     % create random field with autocorrelation
%     [XY] = meshgrid(0:500);
%     Z = randn(size(X));
%     Z = imfilter(Zfspecial(‘gaussian‘[40 40]8));
%
%     % sample the field
%     n = 500;
%     x = rand(n1)*500;
%     y = rand(n1)*500;
%     z = interp2(XYZxy);
%
%     % plot the random field
%     subplot(221)
%     imagesc(X(1:)Y(:1)Z); axis image; axis xy
%     hold on
%     plot(xy‘.k‘)
%     title(‘random field with sampling locations‘)
%
%     % calculate the sample variogram
%     v = variogram([x y]z‘plotit‘false‘maxdist‘100);
%     % and fit a spherical variogram
%     subplot(222)
%     [dumdumdumvstruct] = variogramfit(v.distancev.val[][][]‘model‘‘stable‘);
%     title(‘variogram‘)
%
%     % now use the sampled locations in a kriging
%     [ZhatZvar] = kriging(vstructxyzXY);
%     subplot(223)
%     imagesc(X(1:)Y(:1)Zhat); axis
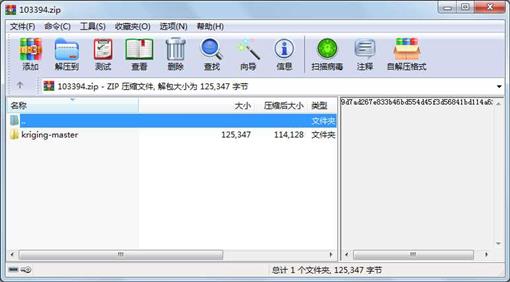
属性 大小 日期 时间 名称
----------- --------- ---------- ----- ----
目录 0 2014-08-28 21:29 kriging-master\
文件 117862 2014-08-28 21:29 kriging-master\kriging.jpg
文件 6165 2014-08-28 21:29 kriging-master\kriging.m
文件 1320 2014-08-28 21:29 kriging-master\license.txt
- 上一篇:批量更改文件名 任意位置插入相同的字符
- 下一篇:恶意dns列表
相关资源
- 编程实现二维DCT变换
- 图像二值化
- vtk QT做的三维地质可视化系统2of2
- 用FFT对信号进行频谱分析
- Tone-Reservation
- QGA 量子遗传算法
- 差分形式的阻滞增长模型
- 遗传算法的M文件
- 简单二阶互联系统的非线性动力学分
- 基于GIS的地质灾害可视化信息系统设
- 遥感技术在地质灾害中的应用
- SPOT-5影像在安徽省矿山地质环境遥感
- Google Earth在地质勘探中的应用
- 手写数字识别-模板匹配法
- Stock_Watson_动态因子分析模型
- 果蝇优化算法优化支持向量回归程序
- 自己做的一个简单GUI扑克纸牌识别-
- multi output SVR
- GB-T958-2015区域地质图图例高清无码带
- AR过程的线性建模过程与各种功率谱估
- PCNN TOOLBOX
- plstoolbox.zip
- 全国耕地质量大数据平台
- 中国国家基础地理信息系统GIS数据
- 粒子群微电网优化调度
- 矩阵分析-经典教材-中文版-Roger.A.Ho
- 压缩感知TwIST
- 基于最小错误率的贝叶斯手写数字分
- 最全系统辨识源代码,包括多种最小
- 导弹制导实验
 川公网安备 51152502000135号
评论
共有 条评论