资源简介
k-means代码

代码片段和文件信息
# -*- coding: utf-8 -*-
“““
Created on Thu Nov 17 16:13:56 2016
@author: phl
“““
print(“k-means算法程序“)
from numpy import *
import time
import matplotlib.pyplot as plt
# 欧几里得聚类计算
def euclDistance(vector1 vector2):
return sqrt(sum(power(vector2 - vector1 2)))
# 随机初始化聚类的中心
def initCentriods(dataSetk):
print(dataSet)
numSamplesdim = dataSet.shape #dim列数
centroids = zeros((k dim))
print(“行数:“numSamples)
print(“列数:“dim)
for i in range(k):
index = int(random.uniform(0 numSamples))
centroids[i :] = dataSet[index :]
return centroids
# k-means cluster
def kmeans(dataSet k):
numSamples = dataSet.shape[0] #dataSet.shape是几行几列的意思,这里是7行2列
print(“行数:“numSamples)
clusterAssment = mat(zeros((numSamples 2)))#初始化一个行两列的0矩阵
clusterChanged = True
## step 1: 初始化聚类中心
centroids = initCentriods(dataSet k)
print(“随机初始化的两个点:“centroids)
## 循环遍历数据
while clusterChanged:
clusterChanged = False
for i in range(numSamples):
minDist = 100000.0
minIndex = 0
## 循环遍历中心点
## step 2:计算离中心点的距离
for j in range(k):
distance = euclDistance(centroids[j :] dataSet[i :])
if distance < minDist:
minDist = distance
minIndex = j #minIndex代表类别
##更新聚类分配
if clusterAssment[i0] != minIndex:
clusterChanged = True
clusterAssment[i :] = minIndex minDist**2
## step 4: 更新聚类中心
for j in range(k):
pointsInCluster = dataSet[nonzero(clusterAssment[: 0].A == j)[0]]
centroids[j :] = mean(pointsInCluster axis = 0)
print(‘恭喜你,聚类完成‘)
return centroids clusterAssment
# show your cluster only available with 2-D data
def showCluster(dataSet k centroids clusterAssment):
numSamples dim = dataSet.shape
if dim != 2:
print(“Sorry! I can not draw because the dimension of your data is not 2!“)
return 1
mark = [‘or‘ ‘ob‘ ‘og‘ ‘ok‘ ‘^r‘ ‘+r‘ ‘sr‘ ‘dr‘ ‘
print(“Sorry! Your k is too large! please contact Zouxy“)
return 1
# draw all samples
for i in range(numSamples):
markIndex = int(clusterAssment[i 0])
plt.plot(dataSet[i 0] dataSet[i 1] mark[markIndex])
mark = [‘Dr‘ ‘Db‘ ‘Dg‘ ‘Dk‘ ‘^b‘ ‘+b‘ ‘sb‘ ‘db‘ ‘
for i in range(k):
plt.plot(centroids[i 0] centroids[i 1] mark[i] markersize = 12)
plt.show()
def showData(dataSet):
x = []
y = []
plt.figure(figsize=(96))
for i in dataSet:
x.append([float(i[0])])
y.append([float(i[1])])
plt.scatter(xyc=“b“s=25alpha=0.4marker=‘o‘)
#T:散点的颜色
#s:散点的大小
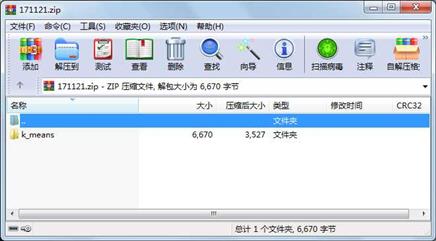
属性 大小 日期 时间 名称
----------- --------- ---------- ----- ----
目录 0 2019-03-22 11:01 k_means\__pycache__\
文件 2552 2018-03-22 19:13 k_means\__pycache__\k_means.cpython-36.pyc
文件 3306 2018-03-22 19:13 k_means\k_means.py
文件 753 2018-04-24 09:34 k_means\test_kmeans.py
文件 59 2018-02-21 18:02 k_means\testSet.txt
相关资源
- bp神经网络源代码,可直接运行
- Pythonamp;课堂amp;笔记(高淇amp;400;集第
- 随机森林R语言代码
- 计算机图形学 边填充算法实现代码
- Python中Numpy库最新教程
- 直流无刷电机方波驱动 stm32 例程代码
- 仿知乎界面小程序源代码
- 贪吃蛇源代码.fla
- 周立功开发板ProASIC3实验-syn_FIFO代码
- IMX385驱动代码.zip
- 用python编写的移动彩信的发送程序
- Python全栈学习笔记面向对象大作业:
- dotnet 写字板 实验 源代码 不好请要不
- 图像二维小波变换的实现源代码
- 八三编码器设计 VHDL代码 简单,包附
- linux应用层的华容道游戏源代码
- 交通咨询模拟系统完整代码
- http请求状态代码
- 数值分析所有实验代码
- python实现的ftp自动上传、下载脚本
- 网上拍卖系统完整源代码
- 音乐代码转换软件 单片机编程时用
- CSMA/CD等动画演示加源代码
- silicon lab公司的收音IC SI47XX全套开发工
- 用51单片机实现G代码翻译
- 合同管理系统的源代码(附数据库)
- 用VC 编写的仿QQ聊天室程序源代码
- web班级网站设计代码
- 38k单片机红外发送代码、keil
- STM32F103 串口程序(完整版)
 川公网安备 51152502000135号
评论
共有 条评论