资源简介
PCA降维+分类器 python语言写的
主成分分析
代码可以跑 python3.6版

代码片段和文件信息
import numpy as np
from matplotlib import pyplot as plt
from mpl_toolkits.mplot3d import Axes3D
from mpl_toolkits.mplot3d import proj3d
from matplotlib.patches import FancyArrowPatch


np.random.seed(1)

mu_vec1 = np.array([0 0 0])
cov_mat1 = np.array([[1 0 0] [0 1 0] [0 0 1]])
class1_sample = np.random.multivariate_normal(mu_vec1 cov_mat1 10).T
assert class1_sample.shape == (3 10) “The matrix has not the dimensions 3x10“


mu_vec2 = np.array([1 1 1])
cov_mat2 = np.array([[1 0 0] [0 1 0] [0 0 1]])
class2_sample = np.random.multivariate_normal(mu_vec2 cov_mat2 10).T
assert class2_sample.shape == (3 10) “The matrix has not the dimensions 3x50“

fig = plt.figure(figsize=(8 8))
ax = fig.add_subplot(111 projection=‘3d‘)
plt.rcParams[‘legend.fontsize‘] = 10
ax.plot(class1_sample[0 :] class1_sample[1 :] class1_sample[2 :] ‘o‘ markersize=8 color=‘blue‘ alpha=0.5
        label=‘class1‘)
ax.plot(class2_sample[0 :] class2_sample[1 :] class2_sample[2 :] ‘^‘ markersize=8 alpha=0.5 color=‘red‘
        label=‘class2‘)

plt.title(‘Samples for class 1 and class 2‘)
ax.legend(loc=‘upper right‘)
plt.show()


all_samples = np.concatenate((class1_sample class2_sample) axis=1)
assert all_samples.shape == (3 20) “The matrix has not the dimensions 3x20“


mean_x = np.mean(all_samples[0 :])
mean_y = np.mean(all_samples[1 :])
mean_z = np.mean(all_samples[2 :])

mean_vector = np.array([[mean_x] [mean_y] [mean_z]])
print(‘Mean Vector:\n‘ mean_vector)


cov_mat = np.cov([all_samples[0 :] all_samples[1 :] all_samples[2 :]])
print(‘Covariance Matrix:\n‘ cov_mat)


eig_val_cov eig_vec_cov = np.linalg.eig(cov_mat)

for i in range(len(eig_val_cov)):
    eigvec_cov = eig_vec_cov[: i].reshape(1 3).T

    print(‘Eigenvector {}: \n{}‘.format(i + 1 eigvec_cov))
    print(‘Eigenvalue {} from covariance matrix: {}‘.format(i + 1 eig_val_cov[i]))
    print(100 * ‘-‘)


class Arrow3D(FancyArrowPatch):
    def __init__(self xs ys zs *args **kwargs):
        FancyArrowPatch.__init__(self (0 0) (0 0) *args **kwargs)
        self._verts3d = xs ys zs

    def draw(self renderer):
        xs3d ys3d zs3d = self._verts3d
        xs ys zs = proj3d.proj_transform(xs3d ys3d zs3d renderer.M)
        self.set_positions((xs[0] ys[0]) (xs[1] ys[1]))
        FancyArrowPatch.draw(self renderer)


fig = plt.figure(figsize=(7 7))
ax = fig.add_subplot(111 projection=‘3d‘)

ax.plot(all_samples[0 :] all_samples[1 :] all_samples[2 :] ‘o‘ markersize=8 color=‘green‘ alpha=0.2)
ax.plot([mean_x] [mean_y] [mean_z] ‘o‘ markersize=10 color=‘red‘ alpha=0.5)
for v in eig_vec_cov.T:
    a = Arrow3D([mean_x v[0]] [mean_y v[1]] [mean_z v[2]] mutation_scale=10 lw=3 arrowstyle=“-|>“ color=“r“)
    ax.add_artist(a)
ax.set_xlabel(‘x_values‘)
ax.set_ylabel(‘y_values‘)
ax.set_zlabel(‘z_values‘)

plt.title(‘Eigenvectors‘)
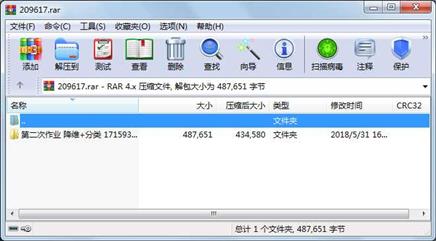
属性 大小 日期 时间 名称
----------- --------- ---------- ----- ----
文件 481459 2018-05-31 16:32 第二次作业 降维+分类 171593苏醒\171593_苏醒_降维+分类器.pdf
文件 6192 2018-05-28 15:13 第二次作业 降维+分类 171593苏醒\171593_苏醒_降维+分类器.py
目录 0 2018-05-31 16:34 第二次作业 降维+分类 171593苏醒
----------- --------- ---------- ----- ----
487651 3
- 上一篇:百度坐标转WGS84坐标程序
- 下一篇:千锋python最新高级教程:数据处理和分析
相关资源
- 二级考试python试题12套(包括选择题和
- pywin32_python3.6_64位
- python+ selenium教程
- PycURL(Windows7/Win32)Python2.7安装包 P
- 英文原版-Scientific Computing with Python
- 7.图像风格迁移 基于深度学习 pyt
- 基于Python的学生管理系统
- A Byte of Python(简明Python教程)(第
- Python实例174946
- Python 人脸识别
- Python 人事管理系统
- 基于python-flask的个人博客系统
- 计算机视觉应用开发流程
- python 调用sftp断点续传文件
- python socket游戏
- 基于Python爬虫爬取天气预报信息
- python函数编程和讲解
- Python开发的个人博客
- 基于python的三层神经网络模型搭建
- python实现自动操作windows应用
- python人脸识别(opencv)
- python 绘图(方形、线条、圆形)
- python疫情卡UN管控
- python 连连看小游戏源码
- 基于PyQt5的视频播放器设计
- 一个简单的python爬虫
- csv文件行列转换python实现代码
- Python操作Mysql教程手册
- Python Machine Learning Case Studies
- python获取硬件信息
 川公网安备 51152502000135号
评论
共有 条评论