资源简介
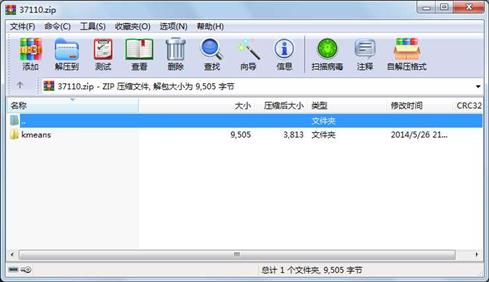
用python写的一个k-means聚类算法的实现,测试数据在压缩包的data.txt中,结果通过图示的方法进行直观展示。

代码片段和文件信息
from numpy import *
import time
import matplotlib.pyplot as plt
# calculate Euclidean distance
def euclDistance(vector1 vector2):
return sqrt(sum(power(vector2 - vector1 2)))
# init centroids with random samples
def initCentroids(dataSet k):
numSamples dim = dataSet.shape
centroids = zeros((k dim))
for i in range(k):
index = int(random.uniform(0 numSamples))
centroids[i :] = dataSet[index :]
return centroids
# k-means cluster
def kmeans(dataSet k):
numSamples = dataSet.shape[0]
# first column stores which cluster this sample belongs to
# second column stores the error between this sample and its centroid
clusterAssment = mat(zeros((numSamples 2)))
clusterChanged = True
## step 1: init centroids
centroids = initCentroids(dataSet k)
while clusterChanged:
clusterChanged = False
## for each sample
for i in xrange(numSamples):
minDist = 100000.0
minIndex = 0
## for each centroid
## step 2: find the centroid who is closest
for j in range(k):
distance = euclDistance(centroids[j :] dataSet[i :])
if distance < minDist:
minDist = distance
minIndex = j
## step 3: update its cluster
if clusterAssment[i 0] != minIndex:
clusterChanged = True
clusterAssment[i :] = minIndex minDist**2
## step 4: update centroids
for j in range(k):
pointsInCluster = dataSet[nonzero(clusterAssment[: 0].A == j)[0]]
centroids[j :] = mean(pointsInCluster axis = 0)
print ‘Congratulations cluster complete!‘
return centroids clusterAssment
# show your cluster only available with 2-D data
def showCluster(dataSet k centroids clusterAssment):
numSamples dim = dataSet.shape
if dim != 2:
print “Sorry! I can not draw because the dimension of your data is not 2!“
return 1
mark = [‘or‘ ‘ob‘ ‘og‘ ‘ok‘ ‘^r‘ ‘+r‘ ‘sr‘ ‘dr‘ ‘
print “Sorry! Your k is too large!“
return 1
# draw all samples
for i in xrange(numSamples):
markIndex = int(clusterAssment[i 0])
plt.plot(dataSet[i 0] dataSet[i 1] mark[markIndex])
mark = [‘Dr‘ ‘Db‘ ‘Dg‘ ‘Dk‘ ‘^b‘ ‘+b‘ ‘sb‘ ‘db‘ ‘
for i in range(k):
plt.plot(centroids[i 0] centroids[i 1] mark[i] markersize = 12)
plt.show() 属性 大小 日期 时间 名称
----------- --------- ---------- ----- ----
文件 80 2014-05-26 14:26 kmeans\data.txt
文件 80 2014-05-26 14:25 kmeans\data.txt~
文件 2749 2014-05-26 14:29 kmeans\kmeans.py
文件 2649 2014-05-26 14:29 kmeans\kmeans.pyc
文件 2749 2014-05-26 14:29 kmeans\kmeans.py~
文件 599 2014-05-26 14:28 kmeans\test.py
文件 599 2014-05-26 14:28 kmeans\test.py~
目录 0 2014-05-26 21:32 kmeans\
相关资源
- 二级考试python试题12套(包括选择题和
- pywin32_python3.6_64位
- python+ selenium教程
- PycURL(Windows7/Win32)Python2.7安装包 P
- 英文原版-Scientific Computing with Python
- 7.图像风格迁移 基于深度学习 pyt
- 基于Python的学生管理系统
- A Byte of Python(简明Python教程)(第
- Python实例174946
- Python 人脸识别
- Python 人事管理系统
- 基于python-flask的个人博客系统
- 计算机视觉应用开发流程
- python 调用sftp断点续传文件
- python socket游戏
- 基于Python爬虫爬取天气预报信息
- python函数编程和讲解
- Python开发的个人博客
- 基于python的三层神经网络模型搭建
- python实现自动操作windows应用
- python人脸识别(opencv)
- python 绘图(方形、线条、圆形)
- python疫情卡UN管控
- python 连连看小游戏源码
- 基于PyQt5的视频播放器设计
- 一个简单的python爬虫
- csv文件行列转换python实现代码
- Python操作Mysql教程手册
- Python Machine Learning Case Studies
- python获取硬件信息
 川公网安备 51152502000135号
评论
共有 条评论