资源简介
一个很好的 雷达仿真界面实现 matlab 实现
很实用

代码片段和文件信息
function analyzBuffer(handlesrecievedSignalprocessedRecivedSignalenergyInRangeCellsPWnThrangeCellIndlocalMaxEnergy)
% function analyzBuffer(handlesrecievedSignalprocessedRecivedSignalenergyInRangeCellsPWnThrangeCellInd)
%
% This function will display the radars bufer content in seperate figures.

temp = get(handles.samplingRate‘string‘);
ind = get(handles.samplingRate‘value‘);
Fs = str2num( temp{ind} )*1e3 ; %Fs was entered in Khz

temp = get(handles.bufferSize‘string‘);
ind = get(handles.bufferSize‘value‘);
nPRI = str2num( temp{ind} ) ;

temp = get(handles.PRI‘string‘);
ind = get(handles.PRI‘value‘);
PRI = str2num( temp{ind} )/1e3 ; %PRI was entered in msec

isMatchFilterUsed = get(handles.useMatchFilter‘value‘);

%--------------------------------------------------------------------------------------
% plotting the time signal
figure(‘name‘‘Buffer Content‘);
subplot(211);
N = length(recievedSignal);
plot([0:N-1]/Fsabs(recievedSignal));
if isMatchFilterUsed
    % if match filter is used - adding the signal after the match filter
    % over the original recived signal
    hold on;
    semilogy([0:N-1]/Fsabs(processedRecivedSignal)‘g‘);
    legend( {‘Recived Signal‘ ; ‘Signal after match Filter‘} );
else
    legend( {‘Recived Signal‘} );
end
title(‘Buffer Content‘);
xlabel(‘[sec]‘);    ylabel(‘volt (log scale)‘);

nRangeCells = length(energyInRangeCells);

if isMatchFilterUsed
    subplot(212);
    h1 = semilogy( [1:nRangeCells]/Fs/1e3*3e8/2 energyInRangeCells‘g‘ );
    hold on;
    h2 = semilogy(  [1 nRangeCells]/Fs/1e3*3e8/2 [Th Th] ‘r‘);
    temp = recievedSignal(rangeCellInd);
    engCellsNoMatchFilter = sum( abs(temp).^22);
    h3 = semilogy([PWn:nRangeCells]/Fs/1e3*3e8/2 engCellsNoMatchFilter(PWn:end)‘b‘);
    legend([h3 h1 h2] {‘Signal in range cells‘ ; ‘Signal after match filter‘ ; ‘used Threshold‘} );
else
    subplot(212);
    h1 = semilogy( [1:nRangeCells]/Fs/1e3*3e8/2 energyInRangeCells‘b‘ );
    hold on;
    h2 = semilogy(  [1 nRangeCells]/Fs/1e3*3e8/2 [Th Th] ‘r‘);
    legend( {‘Signal in range cells‘ ; ‘Threshold‘} );
end
xlabel(‘Range Cells [Km]‘);
ylabel(‘volt^2 (log scale)‘);


%--------------------------------------------------------------------------------------
% plotting the Amplitude in range-cells
signalInRangeCells = processedRecivedSignal(rangeCellInd);

figure(‘name‘‘Amp in Range-Cells‘);
imagesc( [1:nRangeCells]/Fs*3e8/2/1e3 [1:nPRI]*PRI*1e3 log(abs(signalInRangeCells‘))/log(10));
ylabel(‘Time [msec] (PRI steps)‘);xlabel(‘Range Cells [Km]‘); title(‘Amplitude in range Cells (logarythmic scale)‘);
colorbar;

% plotting the Phase in range-cells
figure(‘name‘‘Phase in Range-Cells‘);
imagesc( [1:nRangeCells]/Fs*3e8/2/1e3[1:nPRI]*PRI*1e3 angle(signalInRangeCells‘));
ylabel(‘Time [msec] (PRI steps)‘);xlabel(‘Range Cells [Km]‘); title(‘Phase in range Cells‘);
colorbar;

if ~isempty(localMaxEnergy)
    % plo
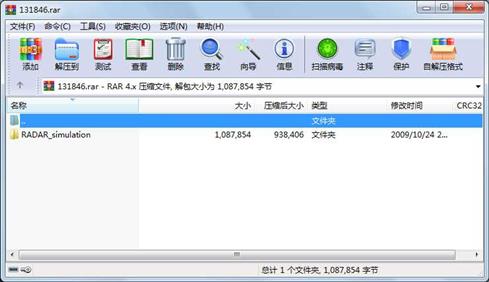
属性 大小 日期 时间 名称
----------- --------- ---------- ----- ----
文件 1002 2008-02-19 02:15 RADAR_simulation\createTargetObj.m
文件 1459 2008-03-13 14:07 RADAR_simulation\createTargets.m
文件 97 2008-02-19 19:17 RADAR_simulation\dAngle.m
文件 1576 2008-03-07 21:05 RADAR_simulation\displayTargets.m
文件 536 2008-03-13 13:59 RADAR_simulation\handleRadarControlls.m
文件 816 2007-12-25 22:31 RADAR_simulation\MTIcalcVelocityFromFourier.m
文件 393 2008-03-13 14:05 RADAR_simulation\placeClutter.m
文件 462 2007-12-14 18:24 RADAR_simulation\plotDistLines.m
文件 1477 2008-03-14 02:13 RADAR_simulation\plotFOV.m
文件 911 2008-03-12 00:21 RADAR_simulation\plotTarget.m
文件 34303 2008-03-28 01:48 RADAR_simulation\radarSimulation.m
文件 23236 2008-04-05 23:53 RADAR_simulation\runRadarSim_v2.m
文件 1561 2008-02-29 15:20 RADAR_simulation\targetsReturn.m
文件 242176 2008-04-06 00:04 RADAR_simulation\Radar Simulation Instructions.doc
文件 14367 2008-03-15 12:27 RADAR_simulation\ociloscopeOff.JPG
文件 11197 2008-03-15 12:28 RADAR_simulation\ociloscopeOn.jpg
文件 11758 2008-03-15 12:29 RADAR_simulation\soundOff.JPG
文件 8549 2008-03-15 12:28 RADAR_simulation\soundOn.JPG
文件 725651 2008-03-28 11:39 RADAR_simulation\radarSimulation.fig
文件 3410 2008-03-11 18:26 RADAR_simulation\analyzBuffer.m
文件 1246 2008-03-11 18:26 RADAR_simulation\analyzBufferWithMTI.m
文件 799 2008-02-29 15:23 RADAR_simulation\buildAntenaGain.m
文件 326 2008-02-19 19:33 RADAR_simulation\calcDiffAngle.m
文件 546 2008-03-28 01:49 RADAR_simulation\changeGuiColors.m
目录 0 2009-10-24 20:25 RADAR_simulation
----------- --------- ---------- ----- ----
1087854 25
相关资源
- matlab_OFDM调制解调(来自剑桥大学)
- Matlab路面裂缝识别69319
- 高灵敏度GPS接收机MATLAB仿真,附捕获
- 基于MATLAB的质点弹道计算与外弹道优
- 阵列天线的matlab仿真
- MATLAB 经典程序源代码大全
- MATLAB小波软阈值去噪代码33473
- 天线阵的波束形成在MATLAB仿真程序及
- 非线性SVM算法-matlab实现
- 《MATLAB 智能算法超级学习手册》-程序
- 组合导航matlab程序
- 读取txt文件内容matlab代码实现
- Matlab实现基于相关的模板匹配程序
- matlab优化工具箱讲解
- 基于MATLAB的快速傅里叶变换
- 光纤传输中的分布傅立叶算法matlab实
- 基于matlab的图像处理源程序
- matlab 椭圆拟合程序
- 算术编码解码matlab源代码
- optical_flow 光流法 matlab 实现程序
- 引导图像滤波器 Matlab实现
- 分形几何中一些经典图形的Matlab画法
- OFDM系统MATLAB仿真代码
- SVM工具箱(matlab中运行)
- 图像小波变换MatLab源代码
- LU分解的MATLAB实现
- 冈萨雷斯数字图像处理matlab版(第三
- 替代数据法的matlab程序
- 用matlab实现的多站定位系统性能仿真
- 通过不同方法进行粗糙集属性约简m
 川公网安备 51152502000135号
评论
共有 条评论