资源简介
Smart Antennas for Wireless Applications.This code creates Figure 7.2, plot of a Bartlett.MATLAB code

代码片段和文件信息
%%%%%%%%%%%%%%%%%%%%%%%%%%%%%%%%%%%%%%%%%%%%%%%%%%%%%%%%%%%%%
%%                                                         %%
%% ******************************************************  %%
%% * Smart Antennas for Wireless Applications w/ Matlab *  %%
%% ******************************************************  %%
%%                                                         %%
%% Chapter 7: Ex 7.5                                       %%
%%                                                         %%
%% Author: Frank Gross                                     %%
%% McGraw-Hill 2005                                       %%
%% Date:  1/26/2004                                        %%
%%                                                         %%
%% This code creates Figure 7.2 plot of a Bartlett        %%
%%     Pseudospectrum for theta1= -5 -10 & theta2 = 5 10 %%
%%%%%%%%%%%%%%%%%%%%%%%%%%%%%%%%%%%%%%%%%%%%%%%%%%%%%%%%%%%%%

%%------------------- Define Variables:--------------------%%
% M - # of elements in array                                %
% sig2 - noise variance                                     %
% th1 th2 - angles of arrival                              %
% a1 a2 a - array steering vectors                        %
% A - Steering vector matrix                                %
% Rss - Source correlation matrix                           %
% Rxx - Array correlation matrix                            %
% P - Bartlett Psuedospectra                                %
%%---------------------------------------------------------%%

%%----- Given Values -----%%

M = 6;  sig2 = 0.1;

disp(‘ ‘)
theta = input(‘  What are the AOA pairs for this plot in degrees? Enter 5 or 10:  ‘);
disp(‘ ‘)
if theta == 5
    th1 = -5*pi/180; th2 = 5*pi/180;
elseif theta == 10
    th1 = -10*pi/180; th2 = 10*pi/180;
end

%%----- Create array steering vectors a1 & a2 -----%%

a1 = [];  a2 = [];
i = 1:M;
% a1 = exp(1j*(i-1)*pi*sin(th1));
% a2 = exp(1j*(i-1)*pi*sin(th2));

a1 = exp(1j*(i-1)*4*pi/16);
a2 = exp(-1j*(i-1)*4*pi/16);
%%----- Create A Rss & Rxx -----%%

A = [a1.‘ a2.‘];
% Rss = [1 0;0 1];   Rxx = A*Rss*A‘ + sig2*eye(M);
Rss = [1 0;0 1];
Rxx = A*Rss*A‘ + sig2*eye(M);
%%----- Create Bartlett Psuedospectrum -----%%

for k = 1:180;
   th(k) = -pi/6 + pi*k/(3*180);
   clear a
   a = [];
   for jj = 1:M
      a = [a exp(1j*(jj-1)*pi*sin(th(k)))];
   end
   Pb(k) = real(a*Rxx*a‘);
end

Pb_dB = 10*log10(Pb/max(Pb));

%%----- Plot Results -----%%

plot(th*180/piPb_dB‘k‘)
grid on
title([‘\bfFigure 7.2 - Bartlett Psuedospectra for \theta = +/-‘num2str(theta)‘^o‘])
xlabel(‘Angle‘)
ylabel(‘|P(\theta)| (dB)‘)
axis([-30 30 -30 10])
属性 大小 日期 时间 名称
----------- --------- ---------- ----- ----
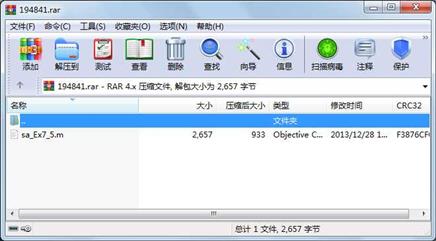
文件 2657 2013-12-28 11:23 sa_Ex7_5.m
----------- --------- ---------- ----- ----
2657 1
- 上一篇:用matlab实现的图像二值化的三种方法
- 下一篇:DOA估计MATLAB代码
相关资源
- MIMO雷达DOA估计中的克拉美罗界计算
- 超多信源的DOA算法估计
- 基于四阶累积量的MUSIC算法——MATLA
- 阵列信号处理张小飞pdf+matlab程序
- 四种传统算法进行DOA估计
- 宽带非相干信号DOA估计
- 相干信号源DOA估计算法MATLAB代码
- 相干信号源DOA估计算法——信号特征
- 基于非相干信号子空间(ISM)的宽带
- 基于MUSIC和ESPRIT算法的信号DOA估计
- 修正的MUSIC算法的DOA估计
- 经典DOA估计GSC旁瓣相消算法算法
- doa估计算法-music算法
- MIMO_DOAMIMO-雷达DOA估计中克拉美罗界
- MVDRCapon波束形成DO估计.zip
- 二维DOA估计中的ROOTMUSIC算法
- 宽带信号DOA估计
- 宽带信号DOA估计SST算法
- 宽带信号DOA估计RSS算法
- 宽带信号DOA估计算法
- DOA估计MATLAB代码
- l1-svd稀疏重构算法
- 均匀阵列基于esprit算法的DOA估计
- PM,MUSIC四阶累积量等几种DOA估计算法
- capon算法的DOA估计MATLAB代码
- 随机信号的DOA估计方法
- 宽带信号的DOA估计.m
- 宽带信号 DOA估计 TCT算法.rar
- 三种esprit算法实现doa估计
- 求根music算法+最小范数music算法 DOA估
 川公网安备 51152502000135号
评论
共有 条评论