资源简介
使用matlab画ROC曲线,% predict - 分类器对测试集的分类结果
% ground_truth - 测试集的正确标签,这里只考虑二分类,即0和1
% auc - 返回ROC曲线的曲线下的面积

代码片段和文件信息
%  predict       - 分类器对测试集的分类结果
%  ground_truth - 测试集的正确标签这里只考虑二分类,即0和1
%  auc            - 返回ROC曲线的曲线下的面积
function  plot_roc()
%初始点为(1.0 1.0)
%计算出ground_truth中正样本的数目pos_num和负样本的数目neg_num
%  predict ground_truth
tic
data = xlsread(‘F:\滑坡\洪都拉斯\多元线性回归数据20170715\ROC_DATA.xlsx‘);
predict = data(:2);
ground_truth = data(:1);
pos_num = sum(ground_truth==1);
neg_num = sum(ground_truth==0);

m=size(ground_truth1);
[preIndex]=sort(predict);
ground_truth=ground_truth(Index);
x=zeros(m+11);
y=zeros(m+11);
auc=0;
x(1)=1;y(1)=1;

for i=2:m
TP=sum(ground_truth(i:m)==1);FP=sum(ground_truth(i:m)==0);
x(i)=FP/neg_num;
y(i)=TP/pos_num;
auc=auc+(y(i)+y(i-1))*(x(i-1)-x(i))/2;
end;

x(m+1)=0;y(m+1)=0;
auc=auc+y(m)*x(m)/2;%计算的面积
disp(‘AUC : ‘)
disp(auc)
%% plot%%
figure
plot(xy‘r‘‘linewidth‘1);
hold on
plot([01][01])
grid on
set(gca‘XTick‘0:0.2:1);
set(gca‘YTick‘0:0.2:1);
axis equal
title(‘ROC Curve‘);
xlabel(‘1 - Specificity‘);
ylabel(‘Sensitivity‘);
set(gca ‘Fontname‘ ‘arial‘);
grid on
toc
end
%% Writed by 王明文 8/29/2017
属性 大小 日期 时间 名称
----------- --------- ---------- ----- ----
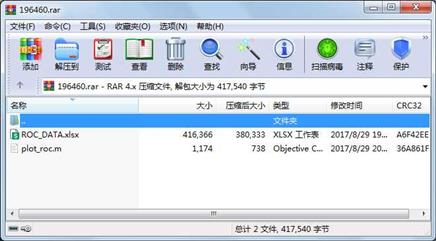
文件 416366 2017-08-29 19:52 ROC_DATA.xlsx
文件 1174 2017-08-29 20:21 plot_roc.m
----------- --------- ---------- ----- ----
417540 2
相关资源
- matlab_OFDM调制解调(来自剑桥大学)
- Matlab路面裂缝识别69319
- 高灵敏度GPS接收机MATLAB仿真,附捕获
- 基于MATLAB的质点弹道计算与外弹道优
- 阵列天线的matlab仿真
- MATLAB 经典程序源代码大全
- MATLAB小波软阈值去噪代码33473
- 天线阵的波束形成在MATLAB仿真程序及
- 非线性SVM算法-matlab实现
- 《MATLAB 智能算法超级学习手册》-程序
- 组合导航matlab程序
- 读取txt文件内容matlab代码实现
- Matlab实现基于相关的模板匹配程序
- matlab优化工具箱讲解
- 基于MATLAB的快速傅里叶变换
- 光纤传输中的分布傅立叶算法matlab实
- 基于matlab的图像处理源程序
- matlab 椭圆拟合程序
- 算术编码解码matlab源代码
- optical_flow 光流法 matlab 实现程序
- 引导图像滤波器 Matlab实现
- 分形几何中一些经典图形的Matlab画法
- OFDM系统MATLAB仿真代码
- SVM工具箱(matlab中运行)
- 图像小波变换MatLab源代码
- LU分解的MATLAB实现
- 冈萨雷斯数字图像处理matlab版(第三
- 替代数据法的matlab程序
- 用matlab实现的多站定位系统性能仿真
- 通过不同方法进行粗糙集属性约简m
 川公网安备 51152502000135号
评论
共有 条评论