资源简介
各种基于形状特征的检索方法都可以比较有效地利用图像中感兴趣的目标来进行检索,本代码是用matlab写的,亲测有效

代码片段和文件信息
function shape_recognition_demo1
try
	clc; % Clear the command window.
	close all; % Close all figures (except those of imtool.)
	workspace; % Make sure the workspace panel is showing.
	fontSize = 15;

	% For reference compute the theoretical circularity of a bunch of regular polygons
	% with different number of sides starting with 3 (triangle).
	dividingValues = PlotTheoreticalCircularity;

	% Make the last dividing value infinity because any circularity from .99999 up to inifinity should be a circle.
	% and sometimes you have a circularity more than 1 due to quantization errors.
	dividingValues(end) = inf;

	% Now create a demo image.
	[binaryImage numSidesCircularity] = CreateDemoImage();
	% Count the number of shapes
	[~ numShapes] = bwlabel(binaryImage);

	% Display the polygon demo image.
	subplot(1 2 1);
	imshow(binaryImage);
	caption = sprintf(‘Image with %d Shapes‘ numShapes);
	title(caption ‘FontSize‘ fontSize);
	hold on; % So that text labels won‘t blow away the image.

	% Set up figure properties:
	% Enlarge figure to full screen.
	set(gcf ‘Units‘ ‘Normalized‘ ‘OuterPosition‘ [0 0 1 1]);
	% Get rid of tool bar and pulldown menus that are along top of figure.
	set(gcf ‘Toolbar‘ ‘none‘ ‘Menu‘ ‘none‘);
	% Give a name to the title bar.
	set(gcf ‘Name‘ ‘Demo by ImageAnalyst‘ ‘Numbertitle‘ ‘Off‘)
	drawnow; % Make it display immediately.

	[labeledImage numberOfobjects] = bwlabel(binaryImage);
	blobMeasurements = regionprops(labeledImage ‘Perimeter‘ ‘Area‘ ‘Centroid‘ ‘Image‘);

	% Now compute the number of vertices by looking at the number of peaks in a plot of distance from centroid.
	numSidesDistance = FindNumberOfVertices(blobMeasurements labeledImage);

	% Get all the measurements into single arrays for convenience.
	allAreas = [blobMeasurements.Area];
	allPerimeters = [blobMeasurements.Perimeter];
	circularities = (4 * pi *  allAreas) ./ allPerimeters.^2
	% Sort in order of increasing circularity
	[sortedCircularities sortOrder] = sort(circularities ‘Ascend‘);
	% Sort all the measurements in the same way.
	blobMeasurements = blobMeasurements(sortOrder);
	allAreas = allAreas(sortOrder);
	allPerimeters = allPerimeters(sortOrder);
	numSidesDistance = numSidesDistance(sortOrder);

	% Plot a bar chart of the circularities.
	subplot(1 2 2);
	bar(sortedCircularities);
	ylim([0.55 1.1]);
	grid on;
	title(‘Actual Measured Circularities‘ ‘FontSize‘ fontSize);

	% Let‘s compute areas a different way.  The “Area“ returned by regionprops is a count of the number of pixels.
	% This sometimes overestimates the area.  Let‘s use bwarea which computes the area on a
	% pixel-center to pixel center basis.
	for k = 1 : numberOfobjects
		thisBlob = blobMeasurements(k).Image;
		allBwAreas(k) = bwarea(thisBlob);
	end
	bwCircularities = (4 * pi *  allBwAreas) ./ allPerimeters.^2
	sortedCircularities = bwCircularities

	% Put up red horizontal line
属性 大小 日期 时间 名称
----------- --------- ---------- ----- ----
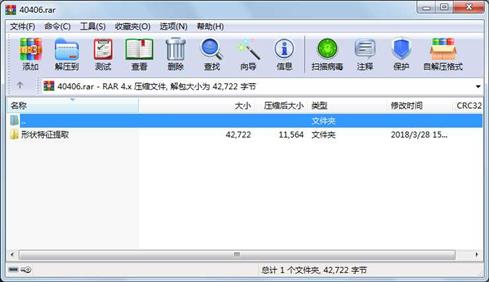
文件 21361 2018-03-28 15:25 形状特征提取\shape_recognition_demo1.m
文件 21361 2018-03-28 15:26 形状特征提取\shape_recognition_demo2.m
目录 0 2018-03-28 15:53 形状特征提取
----------- --------- ---------- ----- ----
42722 3
相关资源
- matlab人脸识别和特征提取
- 高光谱图像pca分析特征提取
- 竞争性自适应重加权
- LBP四种特征提取算法
- MATLAB 灰度共生矩阵特征提取
- matlab纹理特征提取源代码
- MATLAB 特征提取
- 激光雷达采集数据的特征提取
- Gabor滤波后的GIST特征提取matlab代码
- 基于形状与颜色特征融合的图像检索
- CBIR(MATLABHSV直方图,Haar纹理特征,
- matlab利用不变矩提取图片的形状特征
- 基于Matlab的指纹图像特征提取
- matlab指纹匹配
- Matlab特征提取代码
- 图像处理-边缘检测和特征提取MATLAB源
- 利用MATLAB进行音频特征提取
- 图像特征提取源码
- matlab sift特征提取
- LK光流法运动目标特征提取
- 基于matlab下的KL变换
- 用MATLAB实现卷积神经网络CNN,并对图
- matlab常用纹理特征提取方法GLCM,GLD
- 特征提取与图像处理 第二版 高清扫描
- 时域和频域特征提取
- 用LDA和PCA模式识别方法对人脸特征进
- 基于pca特征提取的笑脸表情识别代码
- HOG特征提取分析MATLAB代码
- PCA特征提取方法
- 指纹图像特征提取与matlab实现
 川公网安备 51152502000135号
评论
共有 条评论