资源简介
通过MATLAB绘制一个史密斯圆图,可以显示史密斯圆图的详细细节,并根据给定的参数绘制出发射系数圆等其他图形。很实用

代码片段和文件信息
%Victor Aprea Cornell University 6/27/02
%
%Usage:		plotsmithchart(ZlZo)
%		where Zl is the Load Impedence (possibly complex)
%		and Zo is the Characteristic Line Impedence
%		Plots a smith chart along with the reflection coefficient circle
%		and the line of intersection with resistive component equal to 1.

%		plotsmithchart
%		Without any parameters draws a blank smith chart.
%		Wavelengths toward the generator are labeled around the perimeter
%
%For example:	plotsmithchart(2550)
%		Draws a smithchart calculates and plots the reflection coefficient
%		for a characteristic impedence of 50 ohms and a load impedence of 25 ohms
%		and draws the line of intersection with the R=1 circle.

function answer = plotSmithChart(ZlZo);
constant = linspace(0105);
phaseAngle = linspace(02*pi50);
unitGamma = exp(j*phaseAngle);
%plot the unit circle in the complex plane
hold on;
plot(real(unitGamma)imag(unitGamma)‘r‘);
%set(gcf‘Position‘[0 0 1280 990]);
axis square
zoom on
axis([-1.1 1.1 -1.1 1.1]);

MAX=2001;
bound2=0;
bound3=0;
min_bound1=0;
min_bound2=0;
max_bound2=0;
H=0;
word=0;

Gr = linspace(-11MAX);
hold on;

interval = [[.01:.01:.2][.22:.02:.5][.55:.05:1][1.1:.1:2][2.2:.2:5][6:10][12:2:20][30:10:50]];
interval2= [[.01:.01:.5][.55:.05:1][1.1:.1:2][2.2:.2:5][6:10][12:2:20][30:10:50]];

%plot real axis
plot(Gr zeros(1length(Gr))‘r‘);

%equations were derived using the symbolic toolbox as follows
%solve(‘R=(1-Gr^2-Gi^2)/((1-Gr)^2+Gi^2)‘‘Gi‘)
%bound was derived as follows
%solve(‘1/(R+1)*(-(R+1)*(R-2*R*Gr+R.*Gr^2-1+Gr^2))^(1/2)=0‘‘Gr‘)
for R = interval2
   min_bound1 = (R-1)/(R+1);

   if(R<.2)
      if(mod(R.1)==0)
         max_bound = (-1+2^2+R^2)/(2^2+R^2+2*R+1);
      elseif(mod(R.02)==0)
         max_bound = (-1+.5^2+R^2)/(.5^2+R^2+2*R+1);
      else
         max_bound = (-1+.2^2+R^2)/(.2^2+R^2+2*R+1);
         if(R==.05 | (R<.151 & R>.149))
            min_bound2 = (-1+.5^2+R^2)/(.5^2+R^2+2*R+1);
            max_bound2 = (-1+1^2+R^2)/(1^2+R^2+2*R+1);
         end
      end
   elseif(R<1)
      if(mod(R.2)==0)
         max_bound = (-1+5^2+R^2)/(5^2+R^2+2*R+1);
      elseif(mod(R.1)==0)
         max_bound = (-1+2^2+R^2)/(2^2+R^2+2*R+1);
      elseif(R==.25 | R==.35 | R==.45)
         temp = (-1+.5^2+R^2)/(.5^2+R^2+2*R+1);
         min_bound2 = max(min_bound1 temp);
         max_bound = (-1+1^2+R^2)/(1^2+R^2+2*R+1);
      elseif(R<.5)
         max_bound = (-1+.5^2+R^2)/(.5^2+R^2+2*R+1);
      else
         max_bound = (-1+1^2+R^2)/(1^2+R^2+2*R+1);
      end
   elseif(R<5)
      if(mod(R2)==0)
         max_bound = (-1+20^2+R^2)/(20^2+R^2+2*R+1);
      elseif(mod(R1)==0)
         max_bound = (-1+10^2+R^2)/(10^2+R^2+2*R+1);
      elseif(R>2)
         max_bound = (-1+5^2+R^2)/(5^2+R^2+2*R+1);
      else
         if(mod(R.2)==0)
	         max_bound = (-1+5^2+R^2)/(5^2+R^2+2*R+1);
         else
属性 大小 日期 时间 名称
----------- --------- ---------- ----- ----
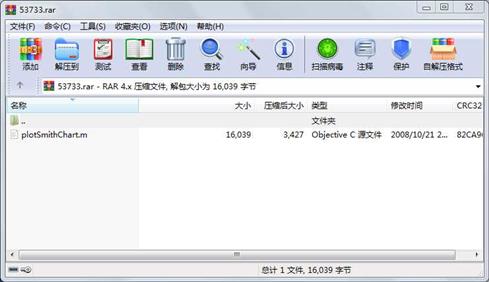
文件 16039 2008-10-21 22:32 plotSmithChart.m
----------- --------- ---------- ----- ----
16039 1
- 上一篇:BP网络的MATLAB实现
- 下一篇:基于74LS161的数字钟仿真
相关资源
- 高灵敏度GPS接收机MATLAB仿真,附捕获
- 基于MATLAB的质点弹道计算与外弹道优
- 阵列天线的matlab仿真
- MATLAB 经典程序源代码大全
- MATLAB小波软阈值去噪代码33473
- 天线阵的波束形成在MATLAB仿真程序及
- 非线性SVM算法-matlab实现
- 《MATLAB 智能算法超级学习手册》-程序
- 组合导航matlab程序
- 读取txt文件内容matlab代码实现
- Matlab实现基于相关的模板匹配程序
- matlab优化工具箱讲解
- 基于MATLAB的快速傅里叶变换
- 光纤传输中的分布傅立叶算法matlab实
- 基于matlab的图像处理源程序
- matlab 椭圆拟合程序
- 算术编码解码matlab源代码
- optical_flow 光流法 matlab 实现程序
- 引导图像滤波器 Matlab实现
- 分形几何中一些经典图形的Matlab画法
- OFDM系统MATLAB仿真代码
- SVM工具箱(matlab中运行)
- 图像小波变换MatLab源代码
- LU分解的MATLAB实现
- 冈萨雷斯数字图像处理matlab版(第三
- 替代数据法的matlab程序
- 用matlab实现的多站定位系统性能仿真
- 通过不同方法进行粗糙集属性约简m
- k近邻算法matlab实现
- matlab识别系统
 川公网安备 51152502000135号
评论
共有 条评论