-
大小: 6KB文件类型: .rar金币: 2下载: 0 次发布日期: 2021-05-21
- 语言: Matlab
- 标签: hough变换 matlab houghlines houghpeaks
资源简介
hough变换matlab程序的houghlines和houghpeaks源代码。

代码片段和文件信息
function lines = houghlines(varargin)
%HOUGHLINES Extract line segments based on Hough transform.
%   LINES = HOUGHLINES(BW THETA RHO PEAKS) extracts line segments
%   in the image BW associated with particular bins in a Hough
%   transform.  THETA and RHO are vectors returned by function HOUGH.
%   Matrix PEAKS which is returned by function HOUGHPEAKS
%   contains the row and column coordinates of the Hough transform
%   bins to use in searching for line segments. HOUGHLINES returns
%   LINES structure array whose length equals the number of merged
%   line segments found. Each element of the structure array has
%   these fields:
%
%      point1  End-point of the line segment; two-element vector
%      point2  End-point of the line segment; two-element vector
%      theta   Angle (in degrees) of the Hough transform bin
%      rho     Rho-axis position of the Hough transform bin
%
%   The end-point vectors contain [X Y] coordinates.
%
%   LINES = HOUGHLINES(...PARAM1VAL1PARAM2VAL2) sets various
%   parameters. Parameter names can be abbreviated and case
%   does not matter. Each string parameter is followed by a value
%   as indicated below:
%
%   ‘FillGap‘   Positive real scalar.
%               When HOUGHLINES finds two line segments associated
%               with the same Hough transform bin that are separated
%               by less than ‘FillGap‘ distance HOUGHLINES merges
%               them into a single line segment.
%
%               Default: 20
%
%   ‘MinLength‘ Positive real scalar.
%               Merged line segments shorter than ‘MinLength‘
%               are discarded.
%
%               Default: 40
%
%   Class Support
%   -------------
%   BW can be logical or numeric and it must be real 2-D and nonsparse.
%
%   Example
%   -------
%   Search for line segments corresponding to five peaks in the Hough
%   transform of the rotated circuit.tif image. Additionally highlight
%   the longest segment.
%
%      I  = imread(‘circuit.tif‘);
%      rotI = imrotate(I33‘crop‘);
%      BW = edge(rotI‘canny‘);
%      [HTR] = hough(BW);
%      imshow(H[]‘XData‘T‘YData‘R‘InitialMagnification‘‘fit‘);
%      xlabel(‘\theta‘) ylabel(‘\rho‘);
%      axis on axis normal hold on;
%      P  = houghpeaks(H5‘threshold‘ceil(0.3*max(H(:))));
%      x = T(P(:2)); y = R(P(:1));
%      plot(xy‘s‘‘color‘‘white‘);
%
%      % Find lines and plot them
%      lines = houghlines(BWTRP‘FillGap‘5‘MinLength‘7);
%      figure imshow(rotI) hold on
%      max_len = 0;
%      for k = 1:length(lines)
%        xy = [lines(k).point1; lines(k).point2];
%        plot(xy(:1)xy(:2)‘LineWidth‘2‘Color‘‘green‘);
%
%        % plot beginnings and ends of lines
%        plot(xy(11)xy(12)‘x‘‘LineWidth‘2‘Color‘‘yellow‘);
%        plot(xy(21)xy(22)‘x‘‘LineWidth‘2‘Color‘‘red‘);
%
%        % determine the endpoints of the longest line segment
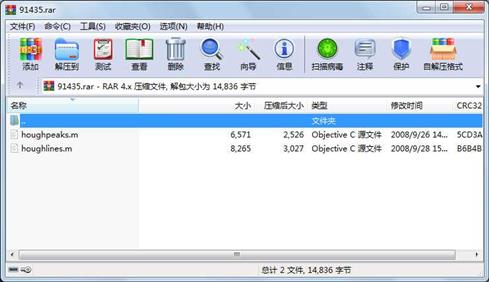
属性 大小 日期 时间 名称
----------- --------- ---------- ----- ----
文件 8265 2008-09-28 15:30 houghlines.m
文件 6571 2008-09-26 14:48 houghpeaks.m
----------- --------- ---------- ----- ----
14836 2
- 上一篇:高斯混合模型GMM 及高斯混合回归MATLAB程序
- 下一篇:l1-Magic工具箱
相关资源
- Matlab路面裂缝识别69319
- 高灵敏度GPS接收机MATLAB仿真,附捕获
- 基于MATLAB的质点弹道计算与外弹道优
- 阵列天线的matlab仿真
- MATLAB 经典程序源代码大全
- MATLAB小波软阈值去噪代码33473
- 天线阵的波束形成在MATLAB仿真程序及
- 非线性SVM算法-matlab实现
- 《MATLAB 智能算法超级学习手册》-程序
- 组合导航matlab程序
- 读取txt文件内容matlab代码实现
- Matlab实现基于相关的模板匹配程序
- matlab优化工具箱讲解
- 基于MATLAB的快速傅里叶变换
- 光纤传输中的分布傅立叶算法matlab实
- 基于matlab的图像处理源程序
- matlab 椭圆拟合程序
- 算术编码解码matlab源代码
- optical_flow 光流法 matlab 实现程序
- 引导图像滤波器 Matlab实现
- 分形几何中一些经典图形的Matlab画法
- OFDM系统MATLAB仿真代码
- SVM工具箱(matlab中运行)
- 图像小波变换MatLab源代码
- LU分解的MATLAB实现
- 冈萨雷斯数字图像处理matlab版(第三
- 替代数据法的matlab程序
- 用matlab实现的多站定位系统性能仿真
- 通过不同方法进行粗糙集属性约简m
- k近邻算法matlab实现
 川公网安备 51152502000135号
评论
共有 条评论