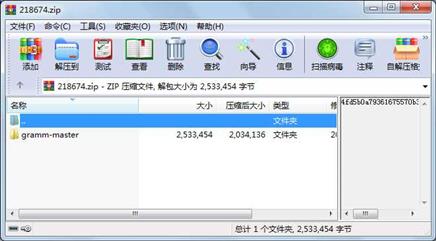
资源简介
如题所示,这是matlab的仿R风格的画图工具包,里面带有教程.

代码片段和文件信息
%% gramm examples and how-tos
%% Example from the readme
% Here we plot the evolution of fuel economy of new cars bewteen 1970 and 1980 (carbig
% dataset). Gramm is used to easily separate groups on the basis of the number of
% cylinders of the cars (color) and on the basis of the region of origin of
% the cars (subplot columns). Both the raw data (points) and a glm fit with
% 95% confidence interval (line+shaded area) are plotted.
%
% We stat by loading the sample data (structure created from the carbig
% dataset)
load example_data;
%%%
% Create a gramm object provide x (year of production) and y (fuel economy) data
% color grouping data (number of cylinders) and select a subset of the data
g=gramm(‘x‘cars.Model_Year‘y‘cars.MPG‘color‘cars.Cylinders‘subset‘cars.Cylinders~=3 & cars.Cylinders~=5);
%%%
% Subdivide the data in subplots horizontally by region of origin using
% facet_grid()
g.facet_grid([]cars.Origin_Region);
%%%
% Plot raw data as points
g.geom_point();
%%%
% Plot linear fits of the data with associated confidence intervals
g.stat_glm();
%%%
% Set appropriate names for legends
g.set_names(‘column‘‘Origin‘‘x‘‘Year of production‘‘y‘‘Fuel economy (MPG)‘‘color‘‘# Cylinders‘);
%%%
% Set figure title
g.set_title(‘Fuel economy of new cars between 1970 and 1982‘);
%%%
% Do the actual drawing
figure(‘Position‘[100 100 800 400]);
g.draw();


%% Grouping options in gramm
% With gramm there are a lot ways to map groups to visual properties of
% plotted data or even subplots.
% Providing grouping variables to change visual properties is done in the
% constructor call |gramm()|. Grouping variables that determine subplotting
% are provided by calls to the |facet_grid()| or |facet_wrap()| methods.
% Note that *all the mappings presented below can be combined* i.e. it‘s
% possible to previde different variables to each of the options.
%
% In order to plot multiple diferent gramm objects in the same figure an array of gramm objects
% is created and the |draw()| function called at the end on the whole array

clear g
g(11)=gramm(‘x‘cars.Horsepower‘y‘cars.MPG‘subset‘cars.Cylinders~=3 & cars.Cylinders~=5);
g(11).geom_point();
g(11).set_names(‘x‘‘Horsepower‘‘y‘‘MPG‘);
g(11).set_title(‘No groups‘);


g(12)=gramm(‘x‘cars.Horsepower‘y‘cars.MPG‘subset‘cars.Cylinders~=3 & cars.Cylinders~=5‘color‘cars.Cylinders);
g(12).geom_point();
g(12).set_names(‘x‘‘Horsepower‘‘y‘‘MPG‘‘color‘‘# Cyl‘);
g(12).set_title(‘color‘);

g(13)=gramm(‘x‘cars.Horsepower‘y‘cars.MPG‘subset‘cars.Cylinders~=3 & cars.Cylinders~=5‘lightness‘cars.Cylinders);
g(13).geom_point();
g(13).set_names(‘x‘‘Horsepower‘‘y‘‘MPG‘‘lightness‘‘# Cyl‘);
g(13).set_title(‘lightness‘);

g(21)=gramm(‘x‘cars.Horsepower‘y‘cars.MPG‘subset‘cars.Cylinders~=3 & cars.Cylinders~=5‘size‘cars.Cylinders);
g(21).geom_point();
g(21).set_names(‘x‘‘Horsepower‘‘y‘‘MPG‘‘size‘‘# Cyl‘);
g(21).set_title(‘size‘);

g(22)=gramm(‘x‘cars.Horsepower‘y‘
属性 大小 日期 时间 名称
----------- --------- ---------- ----- ----
目录 0 2018-03-06 14:57 gramm-master\
文件 50 2018-03-06 14:57 gramm-master\.gitignore
目录 0 2018-03-06 14:57 gramm-master\@gramm\
文件 611 2018-03-06 14:57 gramm-master\@gramm\axe_property.m
文件 876 2018-03-06 14:57 gramm-master\@gramm\coord_flip.m
文件 56923 2018-03-06 14:57 gramm-master\@gramm\draw.m
文件 3760 2018-03-06 14:57 gramm-master\@gramm\export.m
文件 2828 2018-03-06 14:57 gramm-master\@gramm\facet_grid.m
文件 1694 2018-03-06 14:57 gramm-master\@gramm\facet_wrap.m
文件 423 2018-03-06 14:57 gramm-master\@gramm\fig.m
文件 777 2018-03-06 14:57 gramm-master\@gramm\geom_abline.m
文件 4198 2018-03-06 14:57 gramm-master\@gramm\geom_bar.m
文件 1278 2018-03-06 14:57 gramm-master\@gramm\geom_count.m
文件 529 2018-03-06 14:57 gramm-master\@gramm\geom_funline.m
文件 510 2018-03-06 14:57 gramm-master\@gramm\geom_hline.m
文件 1228 2018-03-06 14:57 gramm-master\@gramm\geom_interval.m
文件 1920 2018-03-06 14:57 gramm-master\@gramm\geom_jitter.m
文件 2147 2018-03-06 14:57 gramm-master\@gramm\geom_label.m
文件 4932 2018-03-06 14:57 gramm-master\@gramm\geom_line.m
文件 3469 2018-03-06 14:57 gramm-master\@gramm\geom_point.m
文件 4439 2018-03-06 14:57 gramm-master\@gramm\geom_polygon.m
文件 2228 2018-03-06 14:57 gramm-master\@gramm\geom_raster.m
文件 505 2018-03-06 14:57 gramm-master\@gramm\geom_vline.m
文件 10255 2018-03-06 14:57 gramm-master\@gramm\gramm.m
文件 182 2018-03-06 14:57 gramm-master\@gramm\no_legend.m
目录 0 2018-03-06 14:57 gramm-master\@gramm\private\
文件 1709 2018-03-06 14:57 gramm-master\@gramm\private\LICENSE ColorBrewer.txt
文件 331 2018-03-06 14:57 gramm-master\@gramm\private\comb.m
文件 671 2018-03-06 14:57 gramm-master\@gramm\private\combnan.m
文件 2691 2018-03-06 14:57 gramm-master\@gramm\private\dodge_comp.m
文件 546 2018-03-06 14:57 gramm-master\@gramm\private\dodger.m
............此处省略107个文件信息
相关资源
- matlab_OFDM调制解调(来自剑桥大学)
- Matlab路面裂缝识别69319
- 高灵敏度GPS接收机MATLAB仿真,附捕获
- 基于MATLAB的质点弹道计算与外弹道优
- 阵列天线的matlab仿真
- MATLAB 经典程序源代码大全
- MATLAB小波软阈值去噪代码33473
- 天线阵的波束形成在MATLAB仿真程序及
- 非线性SVM算法-matlab实现
- 《MATLAB 智能算法超级学习手册》-程序
- 组合导航matlab程序
- 读取txt文件内容matlab代码实现
- Matlab实现基于相关的模板匹配程序
- matlab优化工具箱讲解
- 基于MATLAB的快速傅里叶变换
- 光纤传输中的分布傅立叶算法matlab实
- 基于matlab的图像处理源程序
- matlab 椭圆拟合程序
- 算术编码解码matlab源代码
- optical_flow 光流法 matlab 实现程序
- 引导图像滤波器 Matlab实现
- 分形几何中一些经典图形的Matlab画法
- OFDM系统MATLAB仿真代码
- SVM工具箱(matlab中运行)
- 图像小波变换MatLab源代码
- LU分解的MATLAB实现
- 冈萨雷斯数字图像处理matlab版(第三
- 替代数据法的matlab程序
- 用matlab实现的多站定位系统性能仿真
- 通过不同方法进行粗糙集属性约简m
 川公网安备 51152502000135号
评论
共有 条评论